

Summary
The banks had a strong performance in 2021 and are on the path to similar results in 2022. In 2021, the S&P Regional Bank Index was up 37% compared to the S&P 500 Index up 25%. Whilst, UK banks have outperformed European peers by 3% during the past 12 months. Hopes of strong performance in 2022 rest on rising rates and loan growth both materialising.
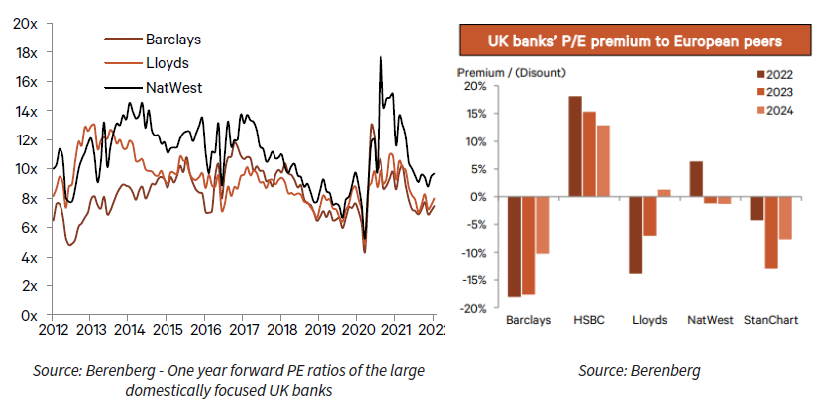
PE multiples are cheap. US banks are below their five-year average and UK banks are below their European peers.
Loan growth gaining momentum. Commercial & industrial loans up 2.6% quarter to date (QTD), consumer loans loosening as leisure spending is expected to rise, and the utilisation rate is hoped to pick up.
Capital positions are strong and above the historical average. The US commercial banks tier 1 ratio average was 15% as of Q3 2021, above the 13% average for the top 25 commercial banks. A similar story in the UK. Therefore, banks are ready for any sudden market shocks.
Rate benefits dominate mortgage pricing. Positive interest rate developments should offset mortgage pricing headwinds. For example, a 10bp fall in new mortgage spreads for one year dilutes UK bank revenues by less than £250m. This is less than a quarter of the revenue benefit from a single 25bp BoE rate rise.
Interesting funds and direct equity. For US exposure, an interesting fund is the JP Morgan US Equity Income (24% in financials). For UK exposure, GAM UK Equity Income (33% in financials) and JO Hambro UK Equity Income (32% in financials) are interesting. For direct equity exposure, in our Approved List we have Lloyds Banking Group, Barclays and Standard Chartered.
US Banks
Performance
The US banks have had a mixed Covid-19. In 2020, the Nasdaq Bank Index was down 14%, and the S&P Regional Bank Index was down 11%, compared with the S&P 500 Index which was up 16%. However, due to their improving credit, increasing capital return to shareholders, improving economic conditions, and the prospect for higher interest rates, 2021 was a very strong year for them. As of Q4 2021, the Nasdaq Bank Index was up 40%, whilst the S&P Regional Bank Index was up 37% compared to the S&P 500 index which was up 25%.
Moving forward, the materialisation of rising rates and loan growth will boost investor confidence. This may be the catalyst for further upside performance of the industry in 2022 and beyond.
Valuations
The two figures below compare the current PE of the US large and small-cap banks to their historical values. Both large and small-cap US banks’ current PE are below their 3 and 5-year average. It is noteworthy to point out that there is a large difference between the small-cap PE when compared to its historical 5-year average and the large caps. This is important because for the past 3 years there has been a lot of volatility due to Covid which makes a comparison to it less reliable.

Looking at price to tangible book value (P/TBV), the large caps are trading c0.25x above their 3 and 5-year averages. Similarly, the small caps are trading above their 3 and 5-year average, however again noting that the difference in the 5-year average is smaller in the small caps than large caps.

ROE and P/B are correlated, for every 10% increase in ROE, there is a 1% increase in P/B; this relationship is shown in the below graph. In the first quarter of 2020, the average ROE for all US banks declined to 3.22% as the Covid-19 pandemic impacted the banking sector. However, ROE rebounded to approximately 14% in the third quarter of 2021. This suggests there is a meaningful upside. Earnings of banks are strongly correlated with rising rates and in a flat rate environment, the sector would be expensive. However, there are several rate hikes expected; consensus interest rate increases are at 5 for 2022. An interesting analysis by JPM and Raymond James showed bank stocks outperformed in 2016 and 2017 when the Fed was raising rates. Therefore, potentially we could see large bank stocks likely continue to benefit from rate hikes and outperform.

Loan Growth
Loan growth is strongly correlated with the economic growth of a country. As we transition out of Covid, US economic growth is expected to be strong which should aid loan growth.

Loan growth has remained challenged over the past 18 months, given significant levels of cash on corporate balance sheets limiting the need for clients to borrow, as well as supply chain and labour issues which have limited the operating capabilities of commercial clients and their need to borrow. However, per fed data, large banks’ total loan growth has improved, led by a step-up in commercial and industrial related loan growth to +2.6% QTD from +0.1% QoQ in Q3 of 2021.
Furthermore, on consumer loans, a net of 31% saw loosening standards on credit card applications; net 9.4% saw loosening on loans to purchase new and used autos; net 15.5% saw loosening for consumer loans other than the above mentioned. As we transition out of Covid, spending on leisure and holidays will increase which should positively impact consumer loans. As well as that, there is much hope that utilisation rates could start to normalise in 2022 as supply chain and labour issues are resolved, which would boost loan growth.
Moving forward, Raymond James estimates loan growth can return to a mid-to high-single-digit pace for most banks excluding PPP, with more upside likely for the small and mid-cap banks.
Capital Position
The U.S. commercial banks tier 1 ratio average was 14.6% as of Q3 2021, above the 12.5% average for the top 25 commercial banks. As well as that, the banks’ average leverage ratio is 8.75%. Therefore, they have strong liquidity positions. This is important, especially in uncertain times such as in the Ukraine-Russia crisis that is currently happening.

Period end domestic deposits grew strongly by 13% YoY, following record-high growth in 2020. This firstly means that the US bank liquidity is strong which makes them less risky. Secondly, according to JPM, LDR has bottomed out and is expected to rise given weaker deposit growth as quantitative tightening sets in and an expected recovery in loan trends. Also, credit reserves peaked at 1.83% in Q1 of 2021 however they have been released by banks and are expected to come back to normal levels of 1.60% by 2023. With that being said, the releases sharply boosted earnings per share (EPS) by 28% in Q3 2021 YTD on average. It is expected that US large banks will continue to release their credit reserves which will boost loan growth.

UK Banks
UK Interest Rate Hikes
The BoE raised interest rates by 15bp in December 2021 and then again by 25bp in February 2022. In total, the interest rate is 50bp. The consensus is that rates will reach 150bp by the end of 2022, which perhaps might be excessive.
Are rate hikes priced in?
The UK raised interest rates first and is expected to continue to do so which is positive news for UK financials. However, how much of it is already priced into consensus earnings and valuations. Firstly, UK banks’ consensus NII has increased by 10% since February 2021’s low point. This rise is equivalent to a c50bp interest rate rise. Given, there has only been a 40bp rise in interest rates, that 10% only reflects actual rate hikes as opposed to the expected (extreme) 150bp hike. Secondly, from the below graphs, we can see that minus NatWest, the other two large UK banks are still trading at a discount relative to their European counterparts. Therefore, rate hikes have not been priced into valuations or earnings and the UK banks are still at a discount.
The results from all the big UK-listed banks targeted a return on tangible equity (ROTE) of 10% between now and a year out. With the likes of Standard Chartered on 0.5x tangible book and Barclays on 0.6x tangible book, this suggests meaningful upside to the shares. More importantly from the results last month were the share buybacks; £1bn for Barclays, £2bn for Lloyds, and £750m for NatWest. With the yield curve direction, this is a positive time for banks and it was seen in the confident tone of the management in the results meetings.

UK Mortgage Market
Mortgage market activity is settling above the 2017-19 average. Stamp duty relief was not the sole cause for the high demand for the market but instead has helped to release pent-up demand and has acted as a catalyst for sustained demand. Indicators suggest demand will continue to be strong due to improving economic outlook and rising house prices. The supply of mortgage lending has improved further. Non-prime mortgages such as buy-to-let mortgages were rare before the Covid period however, with them more readily available, supply can meet demand more easily.
Mortgages are low margin but high return industry. However, more recently pricing has intensified to potentially sub-optimal levels. While I am cautious, I am tentatively optimistic that some rationality will resume though. Firstly, some of the apparent price pressure is more symptomatic of lags in banks’ internal pricing (which makes price pressure look worse than it is). Secondly, this is also because I believe, on a longer-term view, that the reduction in quantitative easing assets brought about by the BoE’s QT policy should reduce excess liquidity in the system (which has fuelled competition) and, related, that higher benchmark yields reduce the urgency with which banks deploy volume/liquidity into mortgages.
Net mortgage growth has fallen from the unsustainable highs of peak Covid times. However, annualised growth was 3% in December month-on-month which is stronger versus prior years. Mortgage approvals for house purchases are 6% above the 2017-19 average. Hence, boosting confidence in the growth of the UK mortgage market. Whilst banks expect mortgage demand to ease, they are increasing the supply of mortgages due to a strong economic outlook and the desire for greater risk (this is expected to impact loan-to-value (LTV) mortgages the most).

UK Consumer Credit
Consumer lending fell dramatically during Covid and has yet to fully recover. Total consumer credit lending remains 20% below the 2019 level, whilst rising 0.6% from the low points reached in October 2021. As of October 2021, aggregate UK card transactions had recovered to 15% above the 2019 level. Consumers are prioritising repayments of higher-cost credit; specifically, only 54% of credit card balances are interest-bearing, nearly 1% less than in 2019.
A less indebted consumer market might be a positive tailwind in the midterm given they’ll have greater confidence to spend. Consumer confidence has partially recovered however, it remains below pre-Covid which could be due to inflationary pressures. Therefore, the hypothesis below should materialise in mid to late 2022 as seasonal traveling and leisure spending start to accelerate.

UK Bank’s Capital Position
Due to Covid and consequently government stimulus checks, there has been a massive saving rate. As a result, banks deposit growth has been very high with very small opportunities for loan growth in the same period. As result, the bank LDR has decreased from highs of c105% to c90%. Furthermore, the bank’s liquidity coverage ratio has increased as well. Therefore, from a risk perspective, the banks are well positioned for sudden market shocks.

Rate Hikes
The profitability of the banks is correlated with rate hikes, particularly 5-year gilts. A 25bp rate hike should benefit banks NII by c3% – 6%. As argued above, these rate hikes have yet to be priced into the share price.

Conclusion
The two main detractors to the bank’s performance for the past decade have been investor worry about their robustness in a crisis and low-interest rates. Finally, the banks have had their chance to prove they can weather a crisis. Going into the Covid period they had a strong capital position to sustain themselves of any shocks and now after QE that position is even stronger. Therefore, going forward the banks are more resilient. 65% of banks’ revenue is generated through net interest income (NII). With inflation rising and QT coming to an end, interest rates are expected to rise. Therefore, we can expect NII to rise through strengthening commercial and industrial loans and consumer loans.
As a result, evidence suggest banks have strong fundamentals and could benefit from market tailwinds.
Funds
JP Morgan US Equity Income Fund – 24% Financials
•The JPM US Equity Income Fund investment philosophy is based on the premise that stock selection, focused on undervalued companies with durable franchises, strong management, and consistent dividend payout, should generate consistent returns over the long term.
•The fund can give portfolio exposure to the US large-cap companies with sectoral exposure that is contrarian to the setup of the major US indexes such as the S&P500. This is hoped to reduce correlation with them which should dampen the impact of market downturns on portfolios should there be an index heavy names selloff. Thereby reducing volatility and risk. For example, investors are benefitting from being sheltered from the correction in unprofitable and growth names in the US by being exposed to this fund.
•The only concern, which is being monitored, is the funds increasing exposure to IT.
•The largest positioning of the fund is in financials at 24%. Whilst banks do not comprise of the whole 24%, it is nonetheless the largest in terms of the subsectors of the fund’s financial position.
•Therefore, this fund achieves the objective of giving the investor US bank exposure whilst mitigating the risk of correlation with large-cap indexes.
Global Asset Management (GAM) UK Equity Income – 33% Financials
•The fund is currently attractively valued, with the fund PE around 10x, meaning it is at a discount to the UK market. Also, it has high levels of dividend growth and a starting yield greater than that of the market.
•The fund managers are not sector biased; they allow bottom-up research to dictate their fund positioning. Similar to my research, they also believe there is great overlooked value in UK banks and have recently increased their financial position.
•Recent fund positioning has seen the fund move towards large caps in the UK, something that reflects our view and is one of the reasons for the recent addition of the fund into the Navigator portfolios at the expense of some small-cap exposure. Also, GAM has been held in the Wayfarer for many years.
•Overall, therefore, by investing in GAM the investor is taking a discounted fund position with sensible management who have aligning thoughts as us on financials and large caps.
JO Hambro UK Equity Income – 32% Financials
•The fund is contrarian in its approach and performance. The fund managers are unashamedly value investors. Whilst value has underperformed over the past decade, the fund has delivered a total return of 88.7% versus 72.4% for peer group composite (Trustnet, as of 19.3.21) over the last ten years.
•c60% of the fund is in large-cap, with Barclays being their third-largest position and five of the top ten holdings being in financials.
•Whilst both GAM and JOH agree on financials, a differential of the two funds is their basic material positioning. Basic material is JOH’s second-largest position at 15% versus GAM’s 1.7%. Secondly, whilst Barclay is JOH’s largest bank holding, GAM’s is Lloyds Banking Group; however, both funds have c3.5% exposure to Standard Chartered and it is in their top ten.
•Therefore, whilst both GAM and JOH are UK equity income, the investor gets a differentiated approach to GAM by investing in JOH.
•Given the managers very good long term track record, ability to survive in hostile macro environments, and proven record of not panicking during tough periods (such as the recent geopolitics and corrections), this fund represents a compelling way of compounding both dividends and total returns for clients without paying too much in the process of doing so.
Lloyds Banking Group
•Lloyds 2022 expected PE is at 7.9x whereas total sector PE is at 9.4x. Hence Lloyds is at a discount to the market.
•Lloyds is targeted to achieve a ROTE of 11% by 2024 expected. This is amongst the highest in the UK banks.
•Lloyds recently announced a £2bn share buyback programme. Their Tier 1 capital ratio is at 17.2% which is above their target of 13.5%.
•There is some uncertainty around the change in CEO which is weighing on the share price performance. However, this should be a short-term problem given the new CEO is expected to follow up on the existing value-adding strategies. These are to focus on growing the bank’s underweight sectors such as Wealth and Insurance, further pushing for digitisation and overall improvement in efficiency.
•Thus, Lloyds investors are exposed to a pure UK bank.
Direct Equity
Barclays
•JPM and Berenberg agree that Barclays is undervalued, with the bank trading on 0.6x total book value (TBV).
•The stock is inexpensive given solid capital ratios (Tier 1 of 15.1% Q4 21 vs target of 13-14%) and a strong recovery in PPOP (income before considering funds set aside to provide for future bad debts) this year to above 2019 levels.
•Barclays will continue to see medium-term revenue growth potential within the consumer businesses with a recovery in credit cards in both the UK and US in 2022, resilient mortgage lending, and a recovery in payments income as consumer spending returns.
•With impairments expected to run below normalised levels post-pandemic, JPM forecast ROTE to grow from trough levels of 3.3% in financial year 2020 to 10.0% 24 expected Also, the bank is forecasted to progressively grow its dividend per share, alongside share buybacks of £1bn per annum from financial year 2022 (expected) at an ongoing c8-9% total yield.
•Therefore, investors can take advantage of the positive trends in both US and UK by investing in Barclays whilst simultaneously reducing risk through diversification of geography.
Standard Chartered
•Standard Chartered remains undervalued, trading on 0.6x TBV.
•With Q4 2021 Tier 1 capital of 13.2% and within the group’s target range of 13 -14%, we see Standard Chartered capital ratios strong on an absolute and relative basis with less balance sheet risk relative to their UK peers.
•JPM forecast ROTE of 8% 2024 (expected) with potential to rise to 10% (management’s and Peel Hunt’s target) due to strong tailwinds from rate hikes and cost reductions.
•Alongside the announced $0.75bn share buyback, JPM forecast share buybacks of $1bn, $1.3bn, and $1.5bn for the financial year 2022 to 2024, respectively, at a 60-70% total payout alongside a growing ordinary DPS offering a total yield of c11% financial year 2024 (expected). This is in addition to management intending to distribute more than $5bn of capital to shareholders by financial year 2024 expected.
•Another benefit of Standard Chartered is its exposure to the Asian market, c32% of the bank’s revenue is generated from Asia. We believe that Asia has a lot of growth opportunities and Standard Chartered is a good way to get exposure to it indirectly. Given the zero Covid policy of Asia, especially China, once these economies are fully open, the bank can potentially surprise on the upside with performance. However, there is a headwind risk due to China’s unpredictability. To address this risk, the bank has recently been reducing its Hong Kong exposure, instead preferring Singapore.
•Hence, Standard Chartered investors are exposed to the positive tailwinds of the UK and Asia with a bank that has a strong balance sheet.