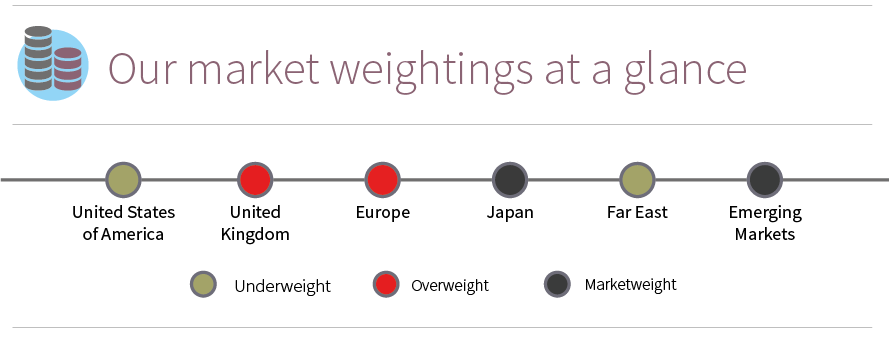
United States of America
There has been some stabilisation in leading indicators with modest improvement seen in industrial production and durable goods orders.
However, we do not yet see a convincing change in the trend to the upside. Employment data looked positive with a strong headline number, although average hours worked fell to a two year low, indicating poor jobs quality. Weak manufacturing survey data has now spread to services and consumer confidence has fallen too. The business inventory to sales ratio rose to a seven year high, an ominous sign with regard to future production. Rising credit spreads and a flattening yield curve indicate a rising level of risk aversion. Corporate results have been disappointing with declines seen in both revenue and earnings, hindered by a strong dollar and weak oil prices. On the positive side, the resilience of the US consumer has helped to support the economy; stripping out gasoline, retail sales expanded by 3.3% on the year. The Federal Reserve dashed expectations for four rate hikes this year. It still anticipates two, although this is above the market’s forecast of only one increase.
United Kingdom
GDP for the fourth quarter of 2015 was upgraded to 2.1% due to increased domestic consumption and business investment.
 Over the first quarter, the consensus forecast for economic growth for 2016 has declined sharply from 2.3% to 2.0% following deterioration in survey data across manufacturing and services. Additionally, the outlook for the first interest rate increase has been pushed back to Q4 2017. We have long viewed rate hikes as unlikely in the medium term. In fact, it is possible that rates could fall before they increase should the economy weaken further. Political uncertainty over Brexit has caused volatility in sterling. Although a vote to leave Europe is the less likely outcome, we believe there are other factors undermining the currency: notably current account and budget deficits, rising government debt and an economy still dependent on the financial and property sectors. This combination leaves the UK vulnerable in the event of a global downturn. With consumer and business confidence waning, retail sales growing at a slower rate and industrial production stagnant, the immediate outlook remains challenging.
Europe
Whilst GDP was upgraded to 1.6% for the fourth quarter of 2015, the joint highest level since 2011, it is coming from a low base.
Nevertheless, the European economy is clearly improving with unemployment falling to 10.3%, the lowest level since 2011, and industrial production growing at its fastest pace for two years. Private sector loan growth for the eurozone expanded at the fastest pace in four years. There is evidence of household and corporate credit picking up in France and Germany, although this is being offset by continued contraction in Spain, Italy and Portugal. Economic output has been boosted by long-term weakness in the euro, a direct consequence of loose monetary policy. This has helped exporters compete better internationally, although the downside will be increased import costs and weaker purchasing power. The ECB moved to an even more aggressive position in March, expanding its Quantitative Easing program to €80bn a month, including the purchase of corporate bonds, and cutting the overnight deposit rate to -0.4%. Despite this extreme action, which demonstrates that the ECB is taking on more risk, the euro strengthened, calling into question the efficacy of monetary policy at the current time. If this trend continues, the gains in the economy may well prove transient in nature.
Far East
China downgraded its official GDP growth target for 2016 to within the range of 6.5-7.0%, following further deterioration in the fourth quarter of 2015 which saw growth fall to 6.8%.
As the equity market has struggled so far this year, following steep declines in 2015, investor attention has returned to the property market which has started to recover. However, gains have been unevenly distributed with first-tier cities like Beijing and Shanghai outperforming smaller cities which remain plagued by overcapacity. The real economy is clearly suffering from negative momentum. Industrial production growth slipped to 5.4%, a fresh seven year low. Trade data has been poor. For the first quarter, exports fell 9.6% and imports 15.5% on the year. This represents the weakest export performance since 2009. PMI survey data for March showed some improvement in China, Taiwan and Korea. Whilst domestic conditions demonstrated some stability, the region is suffering from the effects of weak global demand.
Japan
GDP for the fourth quarter of 2015 was upgraded, although it still contracted by 0.3% on the quarter.
Increased investment and government spending were offset by weaker consumption and a first decline in exports since 2013 as the economy was hit by strength in the yen. Inflation has fallen back to zero and industrial production is contracting. Retail sales also disappointed, missing expectations for the fourth straight month. Whilst Quantitative Easing resulted in short-term gains in terms of improved export performance, these have not been sustained. We see scope for interest rates to be cut further into negative territory. Bond yields remain very low in Japan with the 10 year government bond yield recently dropping below zero, indicating that the long-term prospects for inflation and growth are weak.
 Emerging Markets
There has been a strong recovery across emerging markets from the lows in January. Sentiment has been boosted by a rally in oil and other commodities.
 However, oil remains in surplus and there are few signs that the market will move into balance in the short term given potential for increased US shale production on higher prices and lack of willingness of other producers to cut. Whilst valuations appear relatively attractive following years of underperformance, emerging markets are prone to volatility, especially in countries dominated by commodity production. The decline in GDP in Brazil, for example, accelerated in the fourth quarter of 2015 to 5.9% on the year. Political turmoil has caused further uncertainty, leading to a lowering of growth forecasts for the current year. India remains a bright spot. Following a change in government in 2014, there has been a major anti-corruption drive. There have also been improvements in the current account and budget deficits. With favourable demographics, the country looks well placed to outperform in the long term.
Focus Charts: Exports
Examining trade data can provide an indication into how the economy is performing as it captures change in demand for goods and services.
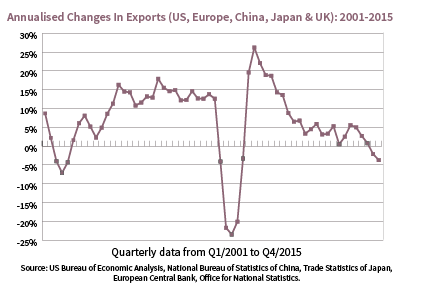
The chart below shows annualised changes for aggregated total exports on a quarterly basis across the US, Europe, China, Japan and the UK. In total these areas account for around 40% of global exports (source, The Economist).
 As can be seen, the index is volatile with sharp changes over time, in particular over the period from 2008 to 2010 as the world slipped into a global recession and subsequently made a strong recovery. These swings partly reflect natural changes throughout the business cycle with recession marked by sharp declines in trade as companies retrench before a period of recovery driven by restocking. Having peaked at an annual rate of 26% in 2010, growth in exports has been declining ever since and started contracting in the third quarter of 2015. Of the five key regions which we have analysed, only Europe is demonstrating any growth. Exports in all the other areas are falling. Should trade continue to fall, producers may be under pressure to cut prices in order to remain competitive. We would then expect the implications to become more widely noticed in global equity markets.

