Divergence in individual stock performance has been a major theme in stock markets this year. This has become even more notable after the referendum. Not only has the internationally focused UK top 100 companies significantly outperformed the more domestic UK top 250 shares this year, but there have also been major divisions within the UK top 100 companies itself.
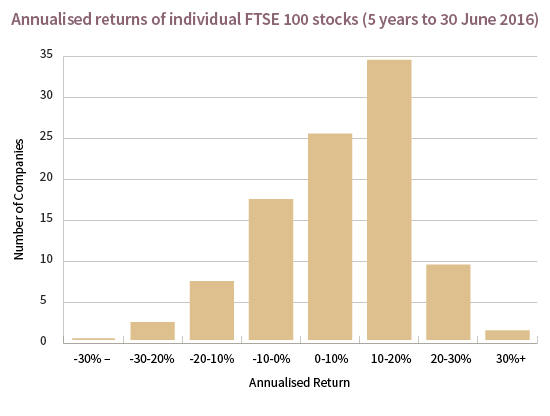
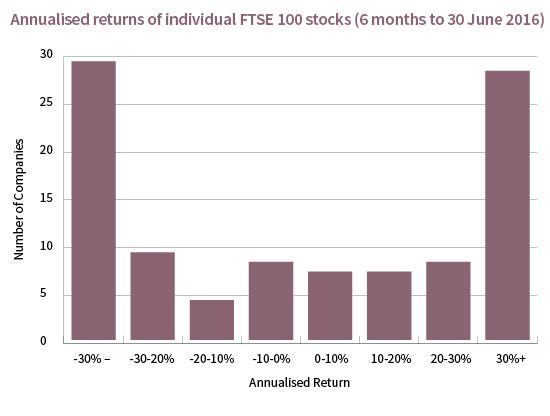
The charts below shows the breakdown of performance of individual UK top 100 companies stocks. We have compared the annualised return of investment on individual stocks over six months and five years to the end of June this year. For the five year period, returns are essentially normally distributed with most stocks returning between 0% and 20% a year on average. However, the data over the six month period is surprising, showing the majority of stocks returning less than -30% or above +30%.
Crudely speaking, we are seeing two different markets within the UK top 100 companies: one group of stocks is in a bull market and the other in a bear market. This is a cause for concern as it indicates a lack of participation across the broader market with returns being generated by a small number of companies which are arguably seeing valuations becoming excessive. This raises questions over the sustainability of the market rally, especially when one considers that banks, the lifeblood of the economy, are without exception all underperforming.