Gross Domestic Product (GDP) is a crucial indicator of the economic health of any country.
It can be calculated by adding consumption, government spending, investment and net exports. Theory demonstrates that a country’s GDP growth rate is comprised of employment and productivity growth across the whole economy. Employment is calculated by the amount of work done in any year with productivity measuring its efficiency.
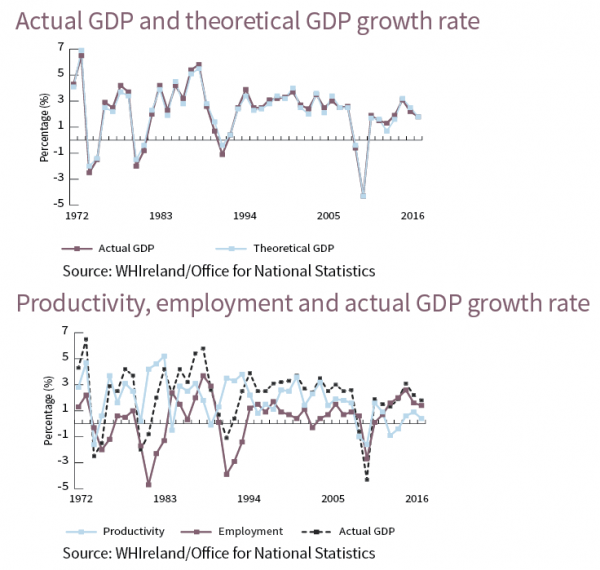
On this basis, we have constructed a theoretical GDP growth rate for the UK for the period 1972 to 2016 and compared it to the actual data. The chart (below) demonstrates that the theoretical GDP composed of employment and productivity numbers has a strong fit with actual GDP. Knowledge of these variables could therefore help to predict future GDP growth rates with a high level of accuracy.
The second chart breaks down the components separately alongside the actual GDP. Employment is highly cyclical; a downturn tends to coincide with recessionary periods. Historically, this has been offset by higher productivity which has reduced the severity of the downturn, notably in 1975, 1980-1 and 1991.In fact, there is a statistically negative correlation over time between the two measures, indicating that they tend to move in opposite directions. The exception was 2009 when both indicators fell.
Given the nature of the economy, a downturn in the future is inevitable and is likely to be accompanied by a decline in employment. But how will productivity fare? A closer look at the data shows that productivity is in a long-term down trend, averaging just 0.1% from 2012 to 2016 against 2.0% for the previous forty years. If it does not recover, it looks likely that the next downturn will resemble 2009 as we will see concurrent weakness in employment and productivity.
This weak trend growth in recent years has been dubbed the “productivity puzzle.” Reasons put forward to explain this phenomenon include low levels of investment, the unwillingness of banks to lend to new businesses, perhaps as a consequence of Quantitative Easing, and more people working beyond retirement age, arguably in less productive jobs. In addition to these reasons, we would suggest that low wage growth is partly responsible. Adjusted for inflation, UK wages are 5% below 2007 levels, meaning that workers are not contributing as much to the economy and have less disposable income. The presence of so-called “zombie companies,” inefficient firms kept alive solely by low interest rates, may also explain low productivity. In looking at employment trends, apart from cyclical factors, other influences include demographics and immigration. However, with an aging population and net migration recently dropping to a three year low following Brexit, the immediate outlook for employment growth looks weak.
Key Takeaways
- Productivity and employment provide an accurate estimate of GDP growth.
- UK GDP has been boosted as the unemployment rate fell from 8% in 2012 to 4.3% today.
- As the economy approaches full employment, near term growth will be limited.
- The future growth trend will be lower if productivity cannot offset any future decline in employment.
- If the low growth environment continues, longer term earnings growth may prove difficult to achieve.
- Investors will need to maintain a highly disciplined approach to stock selection.
- Interest rates are likely to stay low, meaning that income will be highly prized.