
![]()
26 September 2025
The information contained within this announcement is deemed by the Company to constitute inside information as stipulated under the Market Abuse Regulations (EU) No. 596/2014 (MAR) as in force in the United Kingdom pursuant to the European Union (Withdrawal) Act 2018. Upon the publication of this announcement via Regulatory Information Service (RIS), this inside information is now considered to be in the public domain.
WH Ireland Group Plc
(“WH Ireland” or the “Company” and with its subsidiaries the “Group”)
Financial Results for the Twelve Months ended 31 March 2025, Notice of GM and Publication of Annual Report
Financial Results for the Twelve Months ended 31 March 2025
WH Ireland announces its final audited results for the year ended 31 March 2025.
Financial & Operating Summary
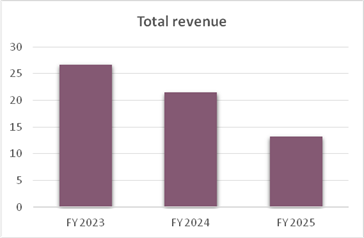
· Revenue of £13.2m (FY 2024: £21.5m) reflecting the sale of the Capital Markets division in July 2024
· Underlying* loss before tax of £1.9m (FY 2024: underlying loss before tax of £2.5m)
· Statutory loss before tax of £9.2m (FY 2024: statutory loss before tax £6.0m) reflecting impact of:
o Restructuring costs £0.9m (FY 2024: £2.9m)
o Impairment of £6.1m (FY 2024: nil)
· Loss per share of 3.97p (232,869,000 shares) (FY 2024: loss of 3.38p, 175,718,000 shares)
· Cash and cash equivalents as at 31 March 2025 of £3.5m (FY 2024: £4.9m)
o Cash and cash equivalents of £3.3m as at 31 August 2025
*A reconciliation from underlying profits to statutory profits is shown within the financial review.
The above results include the Capital Market Division which was sold on 15 July 2024
Pro-forma results of the continuing group comprising wealth management and head office
These pro-forma results consider what the continuing operations results would look like following the disposal of the Capital Markets division. Refer to note 5 of the Annual Report Accounts for further information.
· Revenue of £10.0m (FY 2024: £11.9m) reflecting market falls during the year
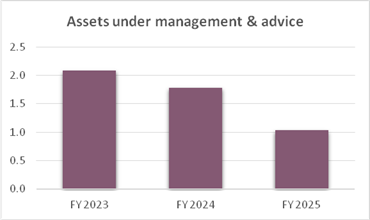
· Total AUM at £1.0bn (FY2024: £1.2bn)
· Underlying loss before tax of £1.9m (FY 2024: underlying loss before tax of £0.6m)
· Statutory loss before tax of £9.1m (FY 2024: loss before tax of £2.8m)
· Loss per share of 3.91p (232,869,000 shares)(FY 2024: loss of 1.57p, 175,718,000 shares)
Post period end events
· Subsequent to the balance sheet date, in September 2025 the Group announced a conditional disposal of its Wealth Management division
Outlook
· With the planned sale of the Wealth Management division, the Group now intends to delist from the AIM market and commence a process of winding down its operations
Commenting, Simon Moore, Non – Executive Chair said:
“Market conditions during the period have had a significant impact on our financial performance leading to a fall in AUM and Wealth Management revenues and losses for the year at both the statutory and underlying levels. With the successful divestment of the Capital Markets division and the planned sale of the Wealth Management division, the Group now intends to delist from the AIM market and commence a process of winding down its operations and returning cash to shareholders.”
Publication of Accounts and Notice of General Meeting
WH Ireland (AIM: WHI), announces that it has published its Annual Report and Accounts for the year ended 31 March 2025 (“Annual Report and Accounts“).
A Notice of General Meeting (“GM“) for WH Ireland’s 2025 GM is being made by the Company today. The GM will be held at the Company’s offices at 24 Martin Lane, London EC4R 0DR on 20 October 2025 at 11.00 a.m. for the purposes of approving the Accounts.
A copy of the Annual Report and Accounts along with a copy of the Notice of GM are available on the Company’s website at www.whirelandplc.com –(in the Annual Reports Section and Circulars and Votes Section respectively). Printed copies are being posted to shareholders who have requested hard copies. All shareholders will be sent a hard copy Form of Proxy for use in connection with the GM.
-END-
For further information please contact:
|
WH Ireland Group plc |
|
|
Simon Jackson, Chief Finance Officer |
+44(0) 20 7220 1666 |
|
Zeus Capital Limited |
|
|
Katy Mitchell |
+44(0) 161 831 1512 |
|
MHP Communications |
|
|
Reg Hoare / Hugo Harris |
+44 (0) 20 7831 406117 |
Notes to Editors:
About WH Ireland Group plc

WH Ireland Group plc is the holding company for WH Ireland Limited (WHI). WHI delivers a high quality service in Wealth Management (WM) providing investment solutions for individuals, families and charities. Previously, WHI had a Capital Markets (CM) division which was a leading firm for public and private companies seeking corporate advice and investment capital.
Classification and Disclosure within Financial Statements
During the year, the Group completed a sale of the CM division and pursued a sale of the WM division. The WM sale was judged to be highly probable at year end and so has been classified as ‘held for sale’ within the Statement of Financial Position with the associated loss for the year being shown within Discontinued Operations within the Statement of Comprehensive Income. A breakdown of these disclosures is shown within note 6 of the Annual Report.
Post year end, the sale of the WM division is still judged to be highly likely. The sale of the CM division completed during the year in July 2024.
Wealth Management
WHI provides financial planning advice and discretionary investment management. Our goal is to build long-term, mutually beneficial, working relationships with our clients so that they can make informed and effective choices about their money and how it can support their lifestyle ambitions. We help clients to build a long-term financial plan and investment strategy for them and their families.
Capital Markets (sold July 2024)
The CM division had been specifically focused on the public and private growth company marketplace. The team’s significant experience in this dynamic segment means that they have been able to provide a specialist service to each of its respective participants. For companies, we have raised public and private growth capital, as well as provided both day-to-day and strategic corporate advice including M&A advisory. The division’s tailored approach means that the team engages with all of the key investor groups active in its market – High Net Worth individuals, Family Offices, Wealth Managers and Funds. The broking, trading and research teams provide the link between growth companies and this broad investor base.
Chair and Chief Executive’s statement
Market backdrop
The market conditions during the period have had a significant impact on our financial performance. While the FTSE 100 has shown signs of recovery, the AIM All-Share Index experienced a decline of 8%. In light of the strategic challenges faced by the company in recent years, as well as public perception concerns, our Assets Under Management (AUM) were similarly affected.
Operating review
Early in the financial year in July 2024, the Group successfully completed the sale of its Capital Markets (CM) division, which was structured on a contingent consideration basis. Following this divestment, the Group shifted its focus to the continued operation and development of its Wealth Management (WM) division, while also exploring potential strategic opportunities as they arise.
Given the ongoing challenges posed by market conditions and persistent inflationary pressures, the Board has pursued a strategy of actively evaluating opportunities to optimise the Group’s portfolio, with a primary focus on the potential sale of all or part of its assets. During the year, we received multiple inquiries from potential buyers interested in acquiring the WM division. Where appropriate, these discussions were actively pursued.
Additionally, following the resignation of key Investment Managers in our Henley office, an agreement was made to transfer our Henley clients to the firm these managers joined. As part of this, the Group also decided to surrender its Henley office lease in order to reduce operational costs and consolidate Wealth Management operations in its remaining London, Manchester, and Poole offices.
Subsequent to the balance sheet date, in September 2025 the Group advanced the sale process for its WM division. Negotiations for this sale had been taking place for much of the financial year, with the sale judged to be highly likely by 31 March 2025. Given the likelihood of a sale in the near term, the WM division was classified as an asset held for sale and a discontinued operation in the subsequent Financial Statements.
Looking forward
With the successful divestment of the CM division and the planned sale of the WM division, the Group now intends to delist from the AIM market and commence a process of winding down its operations. We extend our sincere gratitude to our shareholders for their ongoing support throughout this challenging period, and we appreciate their understanding as we move forward with the wind-down strategy.
The Financial Year 2025
For the financial year 2025, the Group reported a 39% decline in total revenue, from £21.5 million to £13.2 million, largely due to the sale of the CM business in July 2024. Administrative expenses were reduced from £26.7 million to £22.8 million (15%), but excluding impairment charges by 38% to £16.7 million.
The Group also incurred redundancy and project costs totalling £0.9 million, related to the Board’s efforts in exploring strategic opportunities. A profit of £100k was recognised on the sale of the CM division, resulting in an overall pre-tax loss of £9.23 million. An additional £150k of profit was recognised on the previous sale of the Isle of Man business.
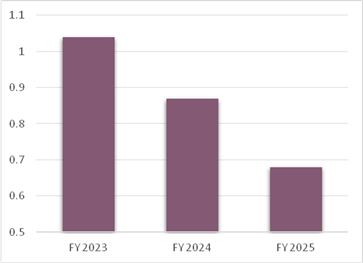
Revenue from the WM division was impacted by market declines, leading to a reduction in total assets under management from £1.2 billion to £1.0 billion. This contributed to a 16% drop in WM revenue, from £11.9 million to £10.0 million. Despite a reduction in operating costs, including staff redundancies, the WM division recorded an underlying loss of £1.85 million.
Revenue from the CM division was recognised until the completion of its sale on 12 July 2024. Contingent consideration of £1.1 million has been recorded in relation to the successful disposal of the CM division as of March 31, 2025, based on projected revenue to be generated by the buyer within the 12 months following the acquisition. For further details, see note 1. This contingent consideration has resulted in a gain on disposal of £100k, which is reflected in the result from discontinued operations (see note 6).
Net cash at year-end was £3.5m (FY24: £4.9m).
Summary
On behalf of the Board, we wish to express our sincere gratitude to all employees for their continued dedication and hard work during this challenging period. Although this has been an unsettling time for all stakeholders, we deeply appreciate the efforts of our employees, clients, and partners in successfully completing the sale of the CM division and for their collaboration in stabilising the business.
As the company moves towards delisting and the winding-down process, the Board’s primary objective will be to ensure an orderly and efficient dissolution of operations. This includes the sale of remaining assets, settlement of liabilities, and management of ongoing contractual obligations. We will focus on minimising costs and protecting the interests of all stakeholders. Throughout this process, the Board will closely assess the strategic value of key business units, identifying assets that can be liquidated or have potential for future strategic opportunities.
While the company is in the process of winding down, we are committed to maintaining a strong focus on optimising cash flow and ensuring transparency to all parties involved. The Board aims to manage the wind-down with discipline and foresight, striving to maximise value for shareholders while ensuring an ethical and responsible closure of operations.
Overview
The WH Ireland Group consists of a principal operating subsidiary, WH Ireland Limited.
WH Ireland Limited is a Wealth Management (WM) company, providing investment solutions for individuals, families and charities. On the 12th July 2024 the Capital Markets (CM) division was disposed. This division provided corporate finance advice and investment banking services.
Total assets managed by the Group are £1.03bn (FY24: £1.78bn). Of this total, all (FY24: £1.2bn) is held in WM.
The Group’s income is derived from activities conducted in the UK although a number of clients are situated worldwide.
The average Group headcount for the year was 84 (FY24: 133) all based in the UK.
Strategy summary
During the year, the Group successfully completed the sale of the CM division on 12 July 2024 to Zeus Capital Limited. The gain on sale of the division is shown within the Statement of Comprehensive Income.
Following the sale of the CM business the strategy for the continuing business of the WM division was initially to drive growth in the assets under management and provide a wider level of service to develop further revenue streams. However, the Group received offers for the division during the year. As a result of which, the Board revised the strategy to pursuing a successful sale of the WM business. This was judged to be highly probable at year end and so the business has been classified as ‘held for sale’ assets within the Statement of Financial with the associated loss for the year being shown within Discontinued Operations.
Group financial results summary
|
|
Year to 31 Mar 2025 £’000 |
Year to 31 Mar 2024 £’000 |
|
Revenue |
13,227 |
21,465 |
|
Operational costs |
(16,655) |
(26,665) |
|
Expected credit loss |
(37) |
(328) |
|
Operating loss |
(3,465) |
(5,528) |
|
|
|
|
|
Net gain (loss) on investments |
99 |
(583) |
|
Gains on fixed assets |
250 |
– |
|
Finance income |
12 |
– |
|
Finance expense |
(12) |
– |
|
Release of deferred consideration |
– |
160 |
|
Other income |
1 |
– |
|
Impairment |
(6,113) |
– |
|
Loss before tax |
(9,228) |
(5,951) |
|
Taxation |
– |
12 |
|
Loss and total comprehensive income for the year |
(9,228) |
(5,939) |
The format of these tables do not follow that in the Statement of Comprehensive Income which is required to show effect of discontinued operations on the business.
Reconciliation between underlying and statutory profits
Underlying profit before tax is considered by the Board to be an accurate reflection of the Group’s performance when compared to the statutory results, as this excludes income and expense categories which are deemed of a non-recurring nature or non-cash operating item. Reporting at an underlying level is also considered appropriate for peer group benchmarking. A reconciliation between underlying and statutory profit before tax for the year ended 31 March 2025 with comparative is shown below:
|
|
Year to 31 Mar 2025 £’000 |
Year to 31 Mar 2024 £’000 |
|
|
Underlying loss before tax |
(1,927) |
(2,468) |
|
|
Amortisation of acquired brand and client relationships |
(664) |
(273) |
|
|
Changes in fair value and finance cost or release of deferred consideration |
– |
160 |
|
|
Restructuring costs |
(872) |
(2,909) |
|
|
Client Settlement |
– |
(152) |
|
|
Other income |
1 |
– |
|
|
Finance income |
12 |
– |
|
|
Finance expense |
(12) |
– |
|
|
Gains on fixed asset |
250 |
– |
|
|
Net changes in the value of non-current investments |
97 |
(309) |
|
|
Impairment |
(6,113) |
– |
|
|
Total underlying adjustments |
(7,301) |
(3,483) |
|
|
|
|
|
|
|
Statutory loss before tax |
(9,228) |
(5,951) |
|
|
Tax |
– |
12 |
|
|
Loss and total comprehensive income for the year |
(9,228) |
(5,939) |
|
|
Underlying earnings per share |
|
|
|
|
Weighted average number of shares (‘000) in issue during the period (note 11) |
232,869 |
175,718 |
|
|
Basic underlying earnings per share |
(0.83p) |
(1.40p) |
|
Amortisation of acquired brand and client relationships
These intangible assets are created in the course of acquiring funds under management and are amortised over their useful life which have been assessed between two to 12 years. This charge has been excluded from underlying profit as it is a significant non-cash item. Amortisation ceased from the date the WM division was reclassified to assets held for sale. The intangible assets have now been allocated to the disposal group at their recoverable value, refer to note 6.
Impairment
An impairment has been recorded to reflect the fair value of the WM division. As the WM division is held for sale, this is the consideration less costs to sell. The impairment is the amount required to reduce the carrying value to this amount, refer to note 4.
Changes in fair value and finance cost of deferred consideration
This comprises the fair value measurement arising on the deferred consideration payments from acquisitions together with the associated finance costs from the unwinding of the present value discount relating to the Harpsden acquisition in previous years.
Restructuring costs
These costs relate to the restructuring costs in WM the resultant costs of redundancies of staff arising from the cost savings measures taken during the year. These costs also include transaction fees paid in relation to the exploration of the potential sale of the WM division and the resultant sale of the CM division.
Client Settlement
This item relates to an issue with our outsourced platform provider, cited in our interim results, which resulted in incorrect amounts of interest being paid to clients. The provider and the Group have settled these amounts with clients.
Gains on fixed asset
This gain relates to two items: the sale of the CM division to Zeus Capital Limited, which settled in September 2025 with a net gain of £100k. During the year we received £150k relating to the sale of IOM business which relates to previous years.
Net changes in value of investments
As part of the fee arrangement with corporate clients in CM, there was often a grant of warrants over shares or the issue of actual shares in addition to the cash element of the fee. The value of such warrants and shares are credited to revenue on the date of the fee note and then any changes in the valuation are recorded as net gains or losses. In view of the nature of these gains or losses, including non-cash, these gains or losses have been excluded from underlying profit. The total change in value of investments was £99k, a corresponding commission payable of £2k on the gain or loss of these warrants is included in the net changes above. The net change in investment value is £97k.
The Financial Year 2025
Overall revenue fell from £21.5m to £13.2m from the previous year (39%), whilst operational costs were reduced by 38% from £26.7m to £16.7m before impairment. The reduction in the revenue is a result of the CM division being sold in July and the market falls affecting WM. Administrative expenses were reduced in line with this.
Although our loss on investments reduced from a £0.6m loss in the previous year to a £0.1m profit, we incurred restructuring costs of £0.9m. These were principally redundancies, and transaction costs in relation to the Board exploring strategic opportunities for parts of the business. This led to a loss overall for the business of £9.23m before tax.
WM income was affected by market falls and uncertainty created by the sale of the CM division which led to a reduction of assets under management from £1.2bn to £1.0bn. This was the principal reason for a fall in WM revenue of 16% (from £11.9m to £10.0m).
Expenses
Total operational costs decreased by 38%, mainly due to sale of CM division. This excludes the one-off impairment charge of £6.1m. As part of cost of sales, third party commission decreased by 56.2%, due to agreements that are revenue contingent. Variable people costs, mainly related to retention bonus payments have increased by 56.4%.
|
|
2025 £’000 |
2024 £’000 |
|
Cost of sales – non-salaried staff costs (note 7) |
697 |
1,592 |
|
Fixed non-people costs |
7,462 |
11,235 |
|
Fixed people costs |
7,012 |
12,881 |
|
Variable people costs |
1,495 |
956 |
|
Impairment |
6,113 |
– |
|
Total |
22,779 |
26,664 |
Financial position and regulatory capital
Net assets reduced to £5.6m at 31 March 2025 (FY24: £14.3m).
The Investment Firms Prudential Regime (IFPR) applies to all solo-regulated MiFID investment firms and WH Ireland is a non-SNI (small and non-interconnected) MIFIDPRU investment firm.
Accordingly, the Group’s regulatory capital requirement is from its harm assessment as defined by the Financial Conduct Authority (FCA). In the prior year the Group carried out a placing to raise £5m by way of the issue of ordinary shares, to ensure that the Group’s own funds are in excess of its regulatory capital requirement. During the year, the sale of the CM division took place. This has had the effect of fixed overhead requirements and wind-down costs for the business falling.
Cost reduction exercises have been implemented during the year, including certain members of senior management agreeing to sacrifice a proportion of their salary in return for share options, alongside a collective consultation regarding headcount reduction.
In light of the likely sale of the WM business, the directors have assessed the going concern of the business and modelled the likely scenario. The Group would initiate a wind down in order to satisfy creditors and shareholders. In this scenario the Group would remain liquid and would retain sufficient cash to distribute to shareholders. As the intention is now complete an orderly wind down, the going concern basis of preparation is no longer appropriate. These financial statements are prepared on a non-going concern basis. Refer to note 1 for further details.
Future developments
Following the likely sale of the WM business the Group plans to initiate delisting and wind down proceedings. The decision to wind down the business is a strategic and voluntary one, and does not arise from financial distress or insolvency concerns. The wind-down is expected to be executed in a controlled and solvent manner, with full consideration for the interests of creditors and shareholders.
Accordingly, the Group has prepared the financial statements on a non-going concern basis.
Key Performance Indicators
The following financial and strategic measures have been identified as the key performance indicators (KPIs) of the Group’s overall performance for the financial year. The sale of the CM division had a significant effect on the following KPI’s.
|
1. GROUP ASSETS UNDER MANAGEMENT The total value of funds under management has a direct impact on the Group’s revenue.
-42%
|
|
|
2. TOTAL REVENUE The amount of revenue generated by WM and CM together is one of the key growth indicators.
|
|
|
3. DISCRETIONARY AND ADVISORY ASSETS UNDER MANAGEMENT (WM)
-22%
|
|


Dividends
The Board does not propose to pay a dividend in respect of the financial year (FY24: £nil).
Statement of Financial Position and Capital Structure
We have been in consultation with the FCA around the sale of the WM business. As the Group will no longer be running a financially regulated business, there will be no regulatory capital requirements that are to be met. At no time going forward in the period under consideration does WH Ireland Group Plc have a cash deficit or a regulatory capital deficit. It is concluded therefore that sufficient funds will be in place to continue the forecasted business model as envisaged and agreed with the Board and shareholders and that the firm is a non-going concern due to the expected wind down. As at 31 March 2025, total net assets were £5.6m (FY24: £14.3m) and net current assets £5.6m (FY24: £14.3m). Net cash at year-end was £3.5m (FY24: £4.9m).
Risks and Uncertainties
Risk appetite is established, reviewed and monitored by the Board. The Group, through the operation of its Committee structure, considers all relevant risks and advises the Board as necessary. The Group maintains a comprehensive risk register as part of its risk management framework encouraging a risk-based approach to the internal controls and management of the Group. The risk register covers all categories including human capital risk, regulatory risk, conduct (client) risk, competition, financial risk, IT and operational resilience risk and legal risk. Each risk is ranked on impact and likelihood and mitigating strategies are identified. In addition, the Executive Committee which is formed of the Executive Directors, the Heads of the business divisions, a representative from HR and Chief Risk and Compliance Officer meet to assess and monitor these. An Executive Risk Committee has recently been established to manage and monitor risks and report into the Board.
The Group outsources its internal audit function to BDO. The internal auditors formally report to Garry Stran, Chair of the Audit Committee with Richard Swain, Chief Risk and Compliance Officer, being the principal day to day contact.
Liquidity and capital risk
During the year the Group focused on managing the costs of its business and returning to growth and sustainable profitability whilst increasing its discretionary fee paying client base in WM to better fit the regulatory environment in which it operates.
To mitigate risk, the Group focused on ensuring that the financial position remains robust and suitably liquid with sufficient regulatory capital being maintained over the minimum common equity tier 1 capital requirements. Regulatory capital and liquid assets are monitored on a daily basis. Once the WM business is sold, the capital risks will no longer be relevant. The planned wind down scenario states that liquidity will be sufficient to fulfil obligations.
Operational risk
Operational risk is the risk of loss to the Group resulting from inadequate or failed internal processes, people and systems, or from external events.
Business continuity risk is the risk that serious damage or disruption may be caused as a result of a breakdown or interruption, from either internal or external sources, of the business of the Group. This risk is mitigated in part by the number of branches across the UK and the Group having business continuity and disaster recovery arrangements including business interruption insurance.
The Group seeks to ensure that its risk management framework and control environment is continuously evolving which Compliance and Risk monitor on an ongoing basis.
Credit risk
The Board takes active steps to minimise credit losses including formal new business approval, and the close supervision of credit limits and exposures, and the proactive management of any overdue accounts. Additionally, risk assessments are performed on an ongoing basis on all deposit taking banks and custodians and our outsourced relationships.
Regulatory risk
The Company operates in a highly regulated environment in the UK. The Directors monitor changes and developments in the regulatory environment and ensure that sufficient resources are available for the Group to implement any required changes. The impact of the regulatory environment on the Group’s management of its capital is discussed in note 25 of the financial statements.
Section 172 Statement
Broader Stakeholder Interests
Directors of the Group must consider Section 172 of the Companies Act 2006 which requires them to act in the way that would most likely promote the success of the Group for the benefit of all its stakeholders. The Board and its committees consider who its key stakeholders are, the potential impact of decisions made on them taking into account a wider range of factors, including the impact on the Company’s operations and the likely consequences of decisions made in the long-term. The Group’s key stakeholders and how the Board and the Group have engaged with them during the year is set out below.
Employees
The CEO and his management team on behalf of the Board engage with employees through a variety of methods including periodic ‘all staff’ updates, information and points of interest, staff forums, group meetings and Town Hall meetings. Further details can be found in the corporate social responsibility section on page 25 of the Annual Report.
Shareholders
Our shareholders have been pivotal in supporting the Group and its management team and Board. The Board recognise and frequently discuss the importance of good, open and constructive relationships with both potential new shareholders as well as existing shareholders and is committed to this communication. The way in which this has been achieved during the year has been by our Chief Executive Officer, supported by the management team, maintaining regular contact and meetings with individual and institutional shareholders, both existing and potential, and communicating and discussing shareholders’ views with the Board. A number of Board members and employees also hold the Group’s shares and regular communications are provided. Having one class of share capital ensures all shareholders are treated equally.
The Group’s strategy and results are presented to shareholders through meetings following announcements of the final and interim results. Shareholders are also invited to meet the Board and management team, who attend the Annual General Meeting. The annual report and accounts for the year ended 31 March 2025 along with all past accounts, regulatory communications and other material is set out on the Group’s website at https://www.whirelandplc.com/investor-relations.
Regulators
The Board maintains continuous and open communication with our regulators at the FCA as well as with the London Stock Exchange. Regular ongoing dialogue has continued through the CEO and CFO with the FCA who receive regular Management information. The FCA have approved the appointments of each member of the Management team and the Board members as required.
Clients
Our clients are fundamental to the business of the Group and the Board recognise that their interests are of paramount importance. Management of WM closely engage with clients to understand their objectives so that the service provided by the business is appropriate. The client’s profile and the suitability of the investment strategy provided is frequently assessed by our professional investment managers and this is supplemented by a second line of review from management and our compliance team. It is recognised that the status of our clients can and does change in line with the environment and vulnerable clients in particular are identified and discussed at management and at Committee level to ensure that they are provided with the best possible advice.
Suppliers, Community and Environment
The Board through its Executive Directors is keenly focused on its key supplier relationships and regularly challenges and reviews its arrangements. The Group openly encourages its offices and employees to engage in local charitable, community groups and other causes. Further detail can be found on page 26 of the Annual Report.
The Board recognises the firm’s duty to act in the best long-term interests of our clients which includes having investment practices that contribute to the preservation of our planet. The Board has had an active effort to continue on our path towards carbon neutrality by consuming less as an organisation, providing recycling points in our offices and planting a new tree for every new investment account opened. Further detail can be found on pages 27-28 of the Annual Report.
Each of the Board members consider that they have acted together, in good faith in a way most likely to promote the success of the Group for the benefit of its broader range of stakeholders as a whole taking into account section 172 (1) (a-f) of the Companies Act 2006.
Maintaining a reputation for high standards of business conduct
The Board supports a culture that encourages the group’s high standards which helps the Group deliver on its strategic objectives. The Board ensures adherence to policies that encourage high performance of employees and regularly receives updates on the group’s culture through engagement surveys and in the business updates.
Considering the Long Term
The Board outlines the Group’s strategy and oversees the framework of governance, risk management and internal controls to with the long-term success of the business in mind. The strategy is focused on developing the Group’s ability to service the long-term needs of its clients. Further detail can be found within the Strategic Report on pages 5 – 11 of the Annual Report. The group operates in a highly regulated environment. The identification, management and mitigation of risks to the group’s business is key to ensuring the delivery of its strategy over the longer term, and the consideration of risk plays an important part in decision-making.
Significant decisions have had to be made in the past year including the decision to sell the CM division last year and the likely sale of the WM business post year end. Following the successful sale of the WM business, an orderly wind down will take place. The Board has taken these decisions in consultation with stakeholders and believes this is the best strategy for the Group in the long term.
The Strategic Report on pages 5 – 11 of the Annual Report has been approved by the Board and signed on its behalf by:
S Jackson
Chief Finance Officer
26 September 2025
Consolidated statement of comprehensive income
|
|
|
Year ended |
|
Year ended |
|||
|
|
|
31 March 2025 |
|
31 March 2024 |
|||
|
|
Note |
£’000 |
|
£’000 |
|||
|
Net profit/(loss) on investments |
16 |
99 |
|
(583) |
|||
|
Release of deferred consideration |
23 |
– |
|
160 |
|||
|
Finance income |
8 |
12 |
|
– |
|||
|
Finance expense |
8 |
(12) |
|
– |
|||
|
Pre-tax profit/(loss) from continuing operations |
|
99 |
|
(423) |
|||
|
Taxation |
9 |
– |
|
12 |
|||
|
Post-tax profit/(loss) from continuing operations |
|
99 |
|
(411) |
|||
|
Loss from discontinued operations inc. tax |
6 |
(9,327) |
|
(5,528) |
|||
|
Loss and total comprehensive income for the year |
|
(9,228) |
|
(5,939) |
|||
|
Earnings per share |
11 |
|
|
|
|
||
|
From continuing operations |
|
|
|
|
|
||
|
Basic and diluted |
|
0.04p |
|
(0.23p) |
|
||
|
From discontinuing operations |
|
|
|
|
|
||
|
Basic and diluted |
|
(4.01p) |
|
(3.15p) |
|
||
|
Total |
|
|
|
|
|
||
|
Basic and diluted |
|
(3.97p) |
|
(3.38p) |
|
||
|
|
|
||||||
Notes on pages 47 to 82 of the Annual Report (and extracted below) are an integral part of these financial statements.
There were no items of other comprehensive income for the current year or prior years. The loss and total comprehensive income is 100% attributable to owners of the parent.
Consolidated and Company statement of financial position
|
|
|
|
|
|
|
|
31 March |
31 March |
|
|
|
2025 |
2024 |
|
|
Note |
£’000 |
£’000 |
|
ASSETS |
|
|
|
|
Non-current assets |
|
|
|
|
Intangible assets |
14 |
– |
– |
|
Goodwill |
13 |
– |
– |
|
Property, plant and equipment |
12 |
– |
– |
|
Investments |
16 |
– |
– |
|
Right of use asset |
17 |
– |
– |
|
Deferred tax asset |
18 |
|
|
|
|
|
– |
– |
|
Current assets |
|
|
|
|
Trade and other receivables |
19 |
3,777 |
5,098 |
|
Other investments |
20 |
84 |
1,544 |
|
Cash and cash equivalents |
21 |
3,459 |
4,902 |
|
Assets held for sale |
6 |
748 |
7,994 |
|
Total current assets |
|
8,068 |
19,538 |
|
Total assets |
|
8,068 |
19,538 |
|
LIABILITIES |
|
|
|
|
Current liabilities |
|
|
|
|
Trade and other payables |
22 |
(1,964) |
(3,232) |
|
Provisions |
23 |
(368) |
(1,676) |
|
Liabilities classified as held for sale |
6 |
(186) |
(293) |
|
Total current liabilities |
|
(2,518) |
(5,201) |
|
Non-current liabilities |
|
– |
– |
|
Total liabilities |
|
(2,518) |
(5,201) |
|
Total net assets |
|
5,550 |
14,337 |
|
|
|
|
|
|
Capital and reserves |
|
|
|
|
Share capital |
26 |
4,965 |
4,965 |
|
Share premium |
26 |
22,817 |
22,817 |
|
Other reserves |
|
981 |
981 |
|
Retained earnings |
|
(22,099) |
(13,312) |
|
Treasury shares |
27 |
(1,114) |
(1,114) |
|
Shareholders’ funds |
|
5,550 |
14,337 |
These financial statements were approved by the Board of Directors on 26 September 2025 and were signed on its behalf by:
S Jackson
Director
|
|
|
Company |
|
|
|
|
31 March |
31 March |
|
|
|
2025 |
2024 |
|
|
Note |
£’000 |
£’000 |
|
ASSETS |
|
|
|
|
Non-current assets |
|
|
|
|
Investment in subsidiaries |
15 |
532 |
19,848 |
|
Loan receivable |
27 |
79 |
1,114 |
|
Amounts owed from Group companies |
19 |
4,050 |
4,676 |
|
|
|
4,661 |
25,638 |
|
Current assets |
|
|
|
|
Trade and other receivables |
19 |
15 |
44 |
|
|
|
15 |
44 |
|
Total assets |
|
4,676 |
25,682 |
|
LIABILITIES |
|
|
|
|
Current liabilities |
|
|
|
|
Trade and other payables |
22 |
(529) |
(750) |
|
Provisions |
23 |
(354) |
(1,229) |
|
Total liabilities |
|
(883) |
(1,979) |
|
Total net assets |
|
3,793 |
23,703 |
|
|
|
|
|
|
Capital and reserves |
|
|
|
|
Share capital |
26 |
4,965 |
4,965 |
|
Share premium |
26 |
22,817 |
22,817 |
|
Other reserves |
|
228 |
228 |
|
Retained earnings |
|
(24,217) |
(4,307) |
|
Shareholders’ funds |
|
3,793 |
23,703 |
The notes on pages 47 to 82 of the Annual Report (and extracted below) are an integral part of these financial statements.
The Company has elected to take the exemption under Section 408 of the Companies Act 2006 not to present the Company statement of comprehensive income. The loss after tax of the Company for the year was £20.4m (FY24: £6.6m).
These financial statements were approved by the Board of Directors on 26 September 2025 and were signed on its behalf by:
S Jackson
Director
Consolidated and Company statement of cash flows
|
|
|
Group |
Company |
||||||
|
|
|
Year ended |
Year ended |
Year ended |
Year ended |
||||
|
|
|
31 Mar 2025 |
31 Mar 2024 |
31 Mar 2025 |
31 Mar 2024 |
||||
|
|
Notes |
£’000 |
£’000 |
£’000 |
£’000 |
||||
|
Operating activities: |
|
|
|
|
|
||||
|
Loss for the year |
|
(9,228) |
(5,939) |
(20,351) |
(6,600) |
||||
|
|
|
(9,228) |
(5,939) |
(20,351) |
(6,600) |
||||
|
Adjustments for non-cash items: |
|
|
|
|
|
||||
|
Depreciation and amortisation |
12, 14, 17 |
947 |
624 |
– |
– |
||||
|
Loss on disposal of property, plant and equipment |
12 |
111 |
– |
– |
– |
||||
|
Finance income |
8 |
(12) |
– |
– |
– |
||||
|
Movement in deferred consideration |
23 |
– |
(160) |
– |
(160) |
||||
|
Finance expense |
8 |
12 |
21 |
– |
– |
||||
|
Tax |
9 |
– |
(12) |
– |
– |
||||
|
Non-cash adjustment for share option charge |
7 |
441 |
338 |
441 |
338 |
||||
|
Non-cash adjustment for investment gains |
16, 20 |
(99) |
583 |
– |
– |
||||
|
Non-cash consideration for revenue |
|
(132) |
(761) |
– |
– |
||||
|
Non-cash adjustment for right of use assets |
17 |
20 |
– |
– |
– |
||||
|
Impairment |
13 |
6,113 |
– |
20,351 |
6,600 |
||||
|
Working capital changes: |
|
|
|
|
|
||||
|
Decrease / (increase) in trade and other receivables |
|
1,436 |
346 |
655 |
(4,851) |
||||
|
Decrease in trade and other payables and provisions* |
|
(2,575) |
(336) |
(1,096) |
(228) |
||||
|
Net cash (used in) / generated from operations |
|
(2,966) |
(5,296) |
– |
(4,901) |
||||
|
Income taxes received/(paid) |
9 |
– |
– |
– |
– |
||||
|
Net cash outflows from operating activities |
|
(2,966) |
(5,296) |
– |
(4,901) |
||||
|
Investing activities: |
|
|
|
|
|
||||
|
Acquisition of property, plant and equipment |
12 |
(10) |
(16) |
– |
– |
||||
|
Increase in loan receivables |
27 |
– |
– |
– |
(21) |
||||
|
Interest received |
8 |
12 |
12 |
– |
– |
||||
|
Cash received on disposal of investments and warrants |
16, 20 |
1,640 |
1,408 |
– |
– |
||||
|
Deferred consideration paid |
23 |
– |
(78) |
– |
(78) |
||||
|
Net cash generated from / (used in) investing activities |
|
1,642 |
1,326 |
– |
(99) |
||||
|
Financing activities: |
|
|
|
|
|
||||
|
Proceeds from issue of share capital |
26 |
– |
5,000 |
– |
5,000 |
||||
|
Purchase of own shares by Employee Benefit Trust |
|
– |
(21) |
– |
– |
||||
|
Lease liability payments |
17 |
(119) |
(340) |
– |
– |
||||
|
Net cash (used in) / generated from financing activities |
|
(119) |
4,639 |
– |
5,000 |
||||
|
Net (decrease) / increase in cash and cash equivalents |
|
(1,443) |
668 |
– |
– |
||||
|
Cash and cash equivalents at beginning of year |
|
4,902 |
4,234 |
– |
– |
||||
|
Cash and cash equivalents at end of year |
|
3,459 |
4,902 |
– |
– |
||||
Non-cash transaction:
* Prior year outstanding deferred consideration of £654k was settled via issue of shares (refer to note 23)
|
|
As at |
Cash flows |
Non-cash |
As at |
|
|
1 April 2024 |
|
changes |
31 March 2025 |
|
Group |
£’000 |
£’000 |
£’000 |
£’000 |
|
Lease liability |
293 |
(119) |
12 |
186 |
|
|
293 |
(119) |
12 |
186 |
Reconciliation of Group and Company liabilities arising from financing activities in the prior year:
|
|
As at |
Cash flows |
Non-cash |
As at |
|
|
1 April 2023 |
|
changes |
31 March 2024 |
|
Group |
£’000 |
£’000 |
£’000 |
£’000 |
|
Lease liability |
612 |
(340) |
21 |
293 |
|
|
612 |
(340) |
21 |
293 |
There are no Company liabilities arising from financing activities.
The notes on pages 47 to 82 of the Annual Report (and extracted below) are an integral part of these financial statements
Consolidated and Company statement of changes in equity
|
|
Share |
Share |
Other |
Retained |
Treasury |
Total |
|
|
capital |
premium |
reserves |
earnings |
shares |
equity |
|
Group |
£’000 |
£’000 |
£’000 |
£’000 |
£’000 |
£’000 |
|
Balance at 1 April 2023 |
3,116 |
19,014 |
981 |
(7,711) |
(1,093) |
14,307 |
|
Loss and total comprehensive income for the year |
– |
– |
– |
(5,939) |
– |
(5,939) |
|
Transactions with owners in their capacity as owners: |
|
|
|
|
|
|
|
Employee share option scheme |
– |
– |
– |
338 |
– |
338 |
|
New share capital issued* |
1,849 |
3,928 |
– |
– |
– |
5,777 |
|
Share issue costs |
– |
(125) |
– |
– |
– |
(125) |
|
Purchase of own shares by Employee Benefit Trust |
– |
– |
– |
– |
(21) |
(21) |
|
Balance at 31 March 2024 |
4,965 |
22,817 |
981 |
(13,312) |
(1,114) |
14,337 |
|
|
|
|
|
|
|
|
|
Loss and total comprehensive income for the year |
– |
– |
– |
(9,228) |
– |
(9,228) |
|
Transactions with owners in their capacity as owners: |
|
|
|
|
|
|
|
Employee share option scheme |
– |
– |
– |
441 |
– |
441 |
|
Balance at 31 March 2025 |
4,965 |
22,817 |
981 |
(22,099) |
(1,114) |
5,550 |
*See further details in note 26.
The notes on pages 47 to 82 of the Annual Report (and extracted below) are an integral part of these financial statements.
Retained earnings include £10k (2024: £10k) ESOT reserve.
|
|
Share |
Share |
Other |
Retained |
Treasury |
Total |
|
|
capital |
premium |
reserves |
earnings |
shares |
equity |
|
Company |
£’000 |
£’000 |
£’000 |
£’000 |
£’000 |
£’000 |
|
Balance at 1 April 2023 |
3,116 |
19,014 |
228 |
1,955 |
– |
24,313 |
|
Loss and total comprehensive income for the year |
– |
– |
– |
(6,600) |
– |
(6,600) |
|
Transactions with owners in their capacity as owners: |
|
|
|
|
|
|
|
Employee share option scheme |
– |
– |
– |
338 |
– |
338 |
|
New share capital issued (note 26) |
1,849 |
3,928 |
– |
– |
– |
5,777 |
|
Share issue costs |
– |
(125) |
– |
– |
– |
(125) |
|
Balance at 31 March 2024 |
4,965 |
22,817 |
228 |
(4,307) |
– |
23,703 |
|
|
|
|
|
|
|
|
|
Loss and total comprehensive income for the year |
– |
– |
– |
(20,351) |
– |
(20,351) |
|
Transactions with owners in their capacity as owners: |
|
|
|
|
|
|
|
Employee share option scheme |
– |
– |
– |
441 |
– |
441 |
|
Balance at 31 March 2025 |
4,965 |
22,817 |
228 |
(24,217) |
– |
3,793 |
The notes on pages 47 to 82 of the Annual Report (and extracted below) are an integral part of these financial statements.
The nature and purpose of each reserve, whether consolidated or Company only, is summarised below:
Share premium
The share premium is the amount raised on the issue of shares that is in excess of the nominal value of those shares and is recorded less any direct costs of issue.
Other reserves
Other reserves comprise a (consolidated) merger reserve of £753k (FY24: £753k) and a (consolidated and company) capital redemption reserve of £228k (FY24: £228k).
Retained earnings
Retained earnings reflect accumulated income, expenses, gains and losses, recognised in the statement of comprehensive income and the statement of recognised income and expense and is net of dividends paid to shareholders. It includes £10k (FY24: £10k) of ESOT reserve.
Treasury shares
Purchases of the Company’s own shares in the market are presented as a deduction from equity, at the amount paid, including transaction costs. That is, shares are shown as a separate class of shareholders’ equity with a debit balance. This includes shares in the Company held by the EBT or ESOT, both of which are consolidated within the consolidated figures.
Notes to the financial statements
1. General information
WH Ireland Group plc is a public company incorporated in the United Kingdom. The shares of the Company are traded on the AIM, a market of the London Stock Exchange Group plc. The address of its registered office is 24 Martin Lane, London, EC4R 0DR.
Basis of preparation
The consolidated and Parent Company financial statements have been prepared in accordance with International Accounting Standards as adopted by the UK and in accordance with the Companies Act 2006. The principal accounting policies adopted in the preparation of the consolidated financial statements are set out in note 3. The policies have been consistently applied to all the years presented, unless otherwise stated.
The consolidated financial statements are presented in British Pounds (GBP), which is also the Group’s functional currency. Amounts are rounded to the nearest thousand, unless otherwise stated.
Non-going concern basis of preparation
The financial statements of the Group have been prepared on a non-going concern basis. In making this assessment, the Directors have prepared detailed financial forecasts for the expected wind down period to June 2026 which consider the funding and capital position of the Group and Company. As the sale of the Wealth Management (WM) business is due to complete by the end of September 2025, the Group has resolved to initiate an orderly wind-down of its operations and pursue a voluntary delisting from the start of October 2025. As a result of these intentions, the basis of preparation as a going concern is no longer appropriate.
However, an orderly wind down will be achieved because:
– The Group has no outstanding external borrowings or material obligations that would compromise its ability to settle liabilities as they fall due.
– Forecast cash flows indicate that the Group will retain sufficient liquidity throughout the wind-down period.
– It is anticipated that, following the satisfaction of all known and expected liabilities, surplus funds will be available for distribution to shareholders.
The decision to wind down the business is a strategic and voluntary one, and does not arise from financial distress or insolvency concerns. The wind-down is expected to be executed in a controlled and solvent manner, with full consideration for the interests of creditors and shareholders. Accordingly, the Directors have a reasonable expectation that the Group has adequate resources to facilitate the orderly wind down. The wind down is expected to be completed by June 2026.
Management have been in consultation with the FCA around the sale of the WM business. As the Group will no longer be running a financially regulated business, there will be no regulatory capital requirements that are to be met. At no time going forward in the period under consideration, based on the analysis in this assessment, does WH Ireland Group Plc have a cash deficit or a regulatory capital deficit.
It is concluded therefore that sufficient funds will be in place to continue the forecasted business model as envisaged and agreed with the Board and shareholders and that the firm is able to complete an orderly wind down. No adjustments have been required to the amounts presented at 31 March 2025 as a result of the non-going concern basis. This is because the closing balance sheet is currently based on the recoverable amount for current assets and the amounts held for disposal groups for the WM disposal have already been written down to their recoverable amount. The wind down model takes these balance sheet values into account.
2. Adoption of new and revised standards
New and amended standards that are effective for the current year
The group has applied amended standards effective for the current period including changes to IAS 1 ‘Presentation of Finance Statements’ (effective 1 January 2024). None of the changes applied have had a material impact on the financial statements. The Directors do not expect any material impact on the financial statements in future periods from the adoption of new or revised accounting standards.
3. Significant accounting policies
Non-current assets (or disposal groups) held for sale and discontinued operations
Non-current assets (or disposal groups) are classified as held for sale if their carrying amount will be recovered principally through a sale transaction rather than through continuing use and a sale is considered highly probable. They are measured at the lower of their carrying amount and fair value less costs to sell.
An impairment loss is recognised for any initial or subsequent write-down of the asset (or disposal group) to fair value less costs to sell. A gain is recognised for any subsequent increases in fair value less costs to sell of an asset (or disposal group), but not in excess of any cumulative impairment loss previously recognised. A gain or loss not previously recognised by the date of the sale of the non-current asset (or disposal group) is recognised at the date of derecognition.
Non-current assets (including those that are part of a disposal group) are not depreciated or amortised while they are classified as held for sale. Interest and other expenses attributable to the liabilities of a disposal group classified as held for sale continue to be recognised.
Non-current assets classified as held for sale and the assets of a disposal group classified as held for sale are presented separately from the other assets in the statement of financial position. The liabilities of a disposal group classified as held for sale are presented separately from other liabilities in the statement of financial position.
A discontinued operation is a component of the entity that has been disposed of or is classified as held for sale and that represents a separate major line of business or geographical area of operations, is part of a single co-ordinated plan to dispose of such a line of business or area of operations, or is a subsidiary acquired exclusively with a view to resale. The results of discontinued operations are presented separately in the statement of profit or loss.
Basis of consolidation
Where the company has control over an investee, it is classified as a subsidiary. The company controls an investee if all three of the following elements are present: power over the investee, exposure to variable returns from the investee and the ability of the investor to use its power to affect those variable returns. Control is reassessed whenever facts and circumstances indicate that there may be a change in any of these elements of control.
The consolidated financial statements present the results of the Company and its subsidiaries (“the Group”) as if they formed a single entity. Intercompany transactions and balances between group companies are therefore eliminated in full. The consolidated financial statements incorporate the results of business combinations using the acquisition method. In the statement of financial position, the acquiree’s identifiable assets, liabilities and contingent liabilities are initially recognised at their fair values at the acquisition date. The results of acquired operations are included in the consolidated statement of comprehensive income from the date on which control is obtained until the date on which control ceased.
In the Company’s accounts, investments in subsidiary undertakings are stated at cost less any provision for impairment.
Business combinations
All business combinations are accounted for by applying the purchase method. The purchase method involves recognition, at fair value, of all identifiable assets and liabilities, including contingent liabilities, of the subsidiary at the acquisition date, regardless of whether or not they were recorded in the financial statements of the subsidiary prior to acquisition. The cost of business combinations is measured based on the fair value of the equity or debt instruments issued and cash or other consideration paid, plus any directly attributable costs. Any directly attributable costs relating to business combinations before or after the acquisition date are charged to the statement of comprehensive income in the period in which they are incurred.
Goodwill arising on a business combination represents the excess of cost over the fair value of the Group’s share of the identifiable net assets acquired and is stated at cost less any accumulated impairment losses. The cash generating units to which goodwill is allocated are tested annually for impairment. Any impairment is recognised immediately in administrative expenses in the statement of comprehensive income and is not subsequently reversed. On disposal of a subsidiary the attributable amount of goodwill that has not been subject to impairment is included in the determination of the profit or loss on disposal.
Revenue
Wealth Management (WM)
Management and custody fees
Investment management fees are recognised in the period in which the related service is provided. It is a variable fee based on the average daily market value of assets under management and is invoiced on a calendar quarter basis in arrears. The performance obligation is satisfied over time as the contractual obligations are on ongoing throughout the period under contract. The revenue accrued but not yet invoiced is recognised as a contract asset.
Initial and ongoing advisory fees
Initial advisory fees are charged to clients on a fixed one-off fee agreement. The performance obligation is satisfied as the initial advice is provided. Ongoing advisory fees are variable fees based on the average daily market value of assets under management and invoiced on a calendar quarter basis in arrears. Both initial and ongoing advisory fees are recognised in the period in which the related service is provided. The performance obligation of ongoing advice is satisfied over time as the contractual obligations are ongoing throughout the period under contract. The revenue accrued but not yet invoiced is recognised as a contract asset.
Commission and transaction charges
Commission is recognised when receivable in accordance with the date of settlement. It is a variable fee based on a percentage of the transaction and therefore the performance obligation is satisfied at the date of the underlying transaction. The transaction price is calculated based on the agreed percentage of the underlying consideration of the trade. The underlying consideration being the number of shares multiplied by the share price at the time of the underlying transaction.
Capital Markets (CM)
Commission
Brokerage commission is recognised when receivable in accordance with the date of settlement. It is a variable fee based on a percentage of the transaction and therefore performance obligation is satisfied at the date of the underlying transaction. The transaction price is calculated based on the agreed percentage of the underlying consideration of the trade. The underlying consideration being the number of shares multiplied by the share price at the time of the underlying transaction.
Corporate finance advisory fees
Corporate finance advisory fees are fixed fees agreed on a deal by deal basis and might include non-cash consideration received in the form of shares, loan notes, warrants or other financial instruments recognised at the fair value on the date of receipt and therefore the performance obligation is satisfied over time when the Group has met the performance obligations per the contract.
Retainer fees
Retainer fees are recognised over the length of time of the agreement. Fees are fixed and invoiced quarterly in advance based on the agreed engagement letter. The performance obligation is satisfied over time as the contractual obligations are on ongoing throughout the period under contract. The deferred revenue is recognised as a contract liability.
Corporate placing commissions
Corporate placing commissions are variable fees agreed on a deal-by-deal basis based on a percentage of the funds raised as part of a transaction. This includes non-cash consideration received in the form of shares, loan notes, warrants or other financial instruments recognised at the fair value on the date of receipt. Given that fees related to this work are success based, there is a significant risk of reversal of the variable revenue and therefore the performance obligation is satisfied at a point in time when the transaction is completed. The combination of corporate placing commissions and corporate finance advisory fees are referred to as corporate success fees.
Employee benefits
The Group contributes to employees’ individual money purchase personal pension schemes. The assets of the schemes are held separately from those of the Group in independently administered funds. The amount charged to the statement of comprehensive income represents the contributions payable to the schemes in respect of the period to which they relate.
Short-term employee benefits are those that fall due for payment within 12 months of the end of the period in which employees render the related service. The cost of short-term benefits is not discounted and is recognised in the period in which the related service is rendered. Short-term employee benefits include cash-based incentive schemes and annual bonuses.
Share-based payments
The share option programmes allow Group employees to receive remuneration in the form of equity-settled share-based payments granted by the Company.
The cost of equity-settled transactions with employees is measured by reference to the fair value at the date at which they are granted. The fair value of the options granted is measured using an option valuation model. The cost of equity-settled transactions is recognised, together with a corresponding increase in equity, over the period in which the performance or service conditions are fulfilled (the vesting period), ending on the date on which the relevant employees become fully entitled to the award (the vesting date). The cumulative expense recognised for equity settled transactions, at each reporting date until the vesting date, reflects the extent to which the vesting period has expired and the Group’s best estimate of the number of equity instruments that will ultimately vest. The statement of comprehensive income charge or credit for a period represents the movement in cumulative expense recognised at the beginning and end of that period.
Where the terms of an equity-settled award are modified, an incremental value is calculated as the difference between the fair value of the repriced option and the fair value of the original option at the date of re-pricing. This incremental value is then recognised as an expense over the remaining vesting period in addition to the amount recognised in respect of the original option grant.
Where an equity-settled award is cancelled or settled (that is, cancelled with some form of compensation) it is treated as if it had vested on the date of cancellation and any expense not yet recognised for the award is recognised immediately.
However, if a new award is substituted for the cancelled award and is designated as a replacement award on the date that it is granted, the cancelled and new awards are treated as if they were a modification of the original award, as described in the previous paragraph. Any compensation paid up to the fair value of the award is accounted for as a deduction from equity. Where an award is cancelled by forfeiture, when the vesting conditions are not satisfied, any costs already recognised are reversed (subject to exceptions for market conditions).
In all instances, the charge/credit is taken to the statement of comprehensive income of the Group or Company by which the individual concerned is employed.
Employee Share Ownership Trust (ESOT)
The Company has established an ESOT. The assets and liabilities of this trust comprise shares in the Company and loan balances due to the Company. The Group includes the ESOT within these consolidated Financial Statements and therefore recognises a Treasury shares reserve in respect of the amounts loaned to the ESOT and used to purchase shares in the Company. Any cash received by the ESOT on disposal of the shares it holds, will be used to repay the loan to the Company.
The costs of purchasing Treasury shares are shown as a deduction against equity. The proceeds from the sale of own shares held increase equity. Neither the purchase nor sale of treasury shares leads to a gain or loss being recognised in the consolidated statement of comprehensive income.
Income taxes
Income tax on the profit or loss for the years presented, comprising current tax and deferred tax, is recognised in the statement of comprehensive income except to the extent that it relates to items recognised directly in equity, in which case it is recognised in equity.
Current tax is the expected tax payable on the taxable income for the year, using rates enacted or substantively enacted at the reporting year-end date and any adjustment to tax payable in respect of previous years.
Deferred tax is provided for temporary differences, at the reporting year-end date, between the tax bases of assets and liabilities and their carrying amounts for financial reporting purposes. The following temporary differences are not provided for;
· goodwill which is not deductible for tax purposes;
· the initial recognition of assets or liabilities that affect neither accounting nor taxable profit; and
· temporary differences relating to investments in subsidiaries to the extent that they will probably not reverse in the foreseeable future.
The amount of deferred tax provided is based on the expected manner of realisation or settlement of the carrying amount of assets and liabilities, using tax rates enacted or substantively enacted at the reporting period end date (note 19).
A deferred tax asset is recognised for all deductible temporary differences and unused tax losses only to the extent that it is probable that future taxable profits will be available against which the assets can be utilised.
Plant and equipment
Plant and equipment is stated at cost less accumulated depreciation and impairment. Depreciation is calculated, using the straight-line method, to write down the cost or revalued amount of plant and equipment over the assets’ expected useful lives, to their residual values, as follows:
Computers, fixtures and fittings – 4 to 7 years
Intangible assets
Measurement
Intangible assets with finite useful lives that are acquired separately are measured, on initial recognition at cost. Following initial recognition, they are carried at cost less accumulated amortisation and any accumulated impairment. The cost of intangible assets acquired in a business combination is their fair value at the date of acquisition.
Intangible assets other than goodwill are amortised over the expected pattern of their consumption of future economic benefits, to write down the cost of the intangible assets to their residual values as follows:
Client relationships – 10 to 12 years
Brand – 2 years
The amortisation period and method for an intangible asset are reviewed at least at each financial year end. Changes in the expected useful life or the expected pattern of consumption of future economic benefits embodied in the asset or its residual value are accounted for by changing the amortisation period or method.
Impairment
The carrying amounts of the Group’s intangible assets, excluding goodwill, are reviewed when there is an indicator of impairment and the asset’s recoverable amount is estimated.
The recoverable amount is the higher of the asset’s fair value less costs to sell (or net selling price) and its value-in-use. Value-in-use is the discounted present value of estimated future cash inflows expected to arise from the continuing use of the asset and from its disposal at the end of its useful life. Where the recoverable amount of an individual asset cannot be identified, it is calculated for the smallest cash-generating unit (CGU) to which the asset belongs. A CGU is the smallest identifiable group of assets that generates cash inflows independently.
When the carrying amount of an asset (or CGU) exceeds its recoverable amount, the asset (or CGU) is considered to be impaired and is written down to its recoverable amount. An impairment loss is immediately recognised as an expense. Any subsequent reversal of impairment credited to the statement of comprehensive income shall not cause the carrying amount of the intangible asset to exceed the carrying amount that would have been determined had no impairment been recognised.
Impairment of assets
Goodwill and other intangible assets that have an indefinite life are not subject to amortisation, they are tested annually for impairment. Other assets are tested for impairment when any changes in circumstance indicate the carrying amount is possibly not recoverable. An impairment loss is recognised when the asset’s carrying amount exceeds its recoverable amount. The recoverable amount is the higher of an asset’s fair value less costs to sell and the value in use. Goodwill is allocated to cash generating units for the purpose of assessing impairment, assets (excluding goodwill) are grouped together based on the assets that independently generates cash flow whose cash flow is largely independent of the cash flows generated by other assets (cash generating units).
Leased assets
Measurement and recognition of leases as a lessee
For any new lease contracts entered into on or after 1 April 2019, as permitted under IFRS 16, the Group recognises a right of use asset and a lease liability except for:
· Leases with a term of 12 months or less from the lease commencement date
· Leases of low value assets
Lease liabilities are measured at the present value of the unpaid lease payments discounted using an incremental borrowing rate.
Right of use assets are initially measured at the amount of the lease liabilities plus initial direct costs, costs associated with removal and restoration and payments previously made. Right of use assets are amortised on a straight-line basis over the term of the lease.
Lease liabilities are subsequently increased by the interest charge using the incremental borrowing rate and reduced by the principal lease.
Financial instruments
Financial assets and financial liabilities are recognised in the Group’s balance sheet when the Group becomes a party to the contractual provisions of the instrument.
Financial assets and liabilities
Investments are recognised and derecognised on the trade date where the purchase or sale of an investment is under a contract whose terms require delivery of the investment within the timeframe established by the market concerned, and are initially measured at fair value, plus transaction costs, except for those financial assets classified as at fair value through profit or loss, which are initially measured at fair value.
Assets and liabilities are presented net where there is a legal right to offset and an intention to settle in that way.
The three principal classification categories for financial assets are: measured at amortised cost, fair value through other comprehensive income (FVOCI) and fair value through profit or loss (FVTPL). The classification of financial assets under IFRS 9 is generally based on the business model in which a financial asset is managed and its contractual cash flow characteristics.
Financial assets are not reclassified after their initial recognition unless the Group changes its business model for managing financial assets, in which case all affected financial assets are reclassified on the first day of the first reporting period following the change in the business model.
A financial asset is measured at amortised cost if it meets both of the following conditions and is not designated as at FVTPL:
· it is held within a business model whose objective is to hold assets to collect contractual cash flows; and
· its contractual terms give rise on specified dates to cash flows that are solely payments of principal and interest on the principal amount outstanding.
On initial recognition of an equity investment that is not held for trading, the Group may irrevocably elect to present subsequent changes in the investment’s fair value in OCI. This election is made on an investment-by-investment basis.
All financial assets not classified as measured at amortised cost or FVOCI as described above are measured at FVTPL. On initial recognition, the Group may irrevocably designate a financial asset that otherwise meets the requirements to be measured at amortised cost or at FVOCI as at FVTPL if doing so eliminates or significantly reduces an accounting mismatch that would otherwise arise.
Assets held at FVTPL are subsequently measured at fair value. Net gains and losses, including any interest or dividend income, are recognised in profit or loss.
Financial assets at amortised cost are subsequently measured at amortised cost using the effective interest method. The amortised cost is reduced by impairment losses. Trade receivables and other receivables are measured and carried at amortised cost using the effective interest method, less any impairment. If impaired, the carrying amount of other receivables is reduced by the impairment loss directly and a charge is recorded in the Income Statement. For trade receivables, the carrying amount is reduced by the expected credit lifetime losses under the simplified approach permitted under IFRS9. Subsequent recoveries of amounts previously written off are credited against the allowance account and changes in the carrying amount of the allowance account are recognised in the Income Statement.
Equity investments at FVOCI are subsequently measured at fair value. Dividends are recognised as income in profit or loss unless the dividend clearly represents a recovery of part of the cost of the investment. Other net gains and losses are recognised in OCI and are never reclassified to profit or loss.
The following financial assets & liabilities are held at FVTPL; investments and deferred consideration. The following financial assets and liabilities are held at amortised cost; Cash and cash equivalents, trade and other receivables, contract assets, trade and other payables and lease liabilities.
Trade payables
Trade payables principally comprise amounts outstanding for trade purchases and ongoing costs. The Directors consider that the carrying amount of trade payables approximates to their fair value.
4. Critical accounting judgements and key sources of estimation and uncertainty
The preparation of financial statements in accordance with IFRS requires management to make judgements, estimates and assumptions that affect the application of accounting policies and the reported amounts of assets, liabilities, income and expenses. Actual results may differ from these estimates.
Estimates and judgements are continually evaluated and are based on historical experience and other factors, including reasonable expectations of future events. The estimates and judgements that have a significant risk of causing a material adjustment to the carrying amounts of assets and liabilities within the next financial year are discussed below:
Identification and classification of discontinued operations and disposal group assets and liabilities
During the year, the Group pursued a sale of the WM division. The sale of the division was deemed to be highly probable on the date the bid was received from the preferred bidder and the Takeover Panel was formally notified. This was 31st January 2025. At year end the WM division has been classed as such and assets and liabilities held for sale have been allocated to the associated disposal group. Once assets and liabilities were added to the disposal group at this date, no amortisation or depreciation has been recoded.
Post year end, the WM sale is still ongoing. The intention is still to continue with the sale to the preferred bidder so the WM division remains classified as held for sale at that date.
As the WM division is a component that has been classified as held for sale and represents a major line of business, it meets the conditions of IFRS 5 to be discontinued. The Statement of Comprehensive Income shows the results from the discontinued operations. The Statement of Financial Position has the assets and liabilities held for sale. These have been allocated to the disposal groups as detailed in note 6.
Amortisation and impairment of non-financial assets
As noted above, the Group estimates the useful economic lives of intangible assets, in order to calculate the appropriate amortisation charge. This is done by the Directors using their knowledge of the markets and business conditions that generated the asset, together with their judgement of how these will change in the foreseeable future.
The value of the Wealth Management division is mainly based on its client relationships and its revenue generating ability. As the sale of the WM division is expected to complete post year end and by 30th September 2025, the recoverable amount has been assessed based on the estimated fair value less costs of disposal which equates to £0.5m. The most appropriate basis of measuring the fair value has been judged to be the estimated sale price of the CGU as this best shows the market value. In the prior year the recoverable amount was measured using a value in use calculation. The assessment has resulted in an impairment charge totalling £6.1m being recognised against the non-financial assets as explained below.
Allocation of impairment loss to a disposal group
The CGU is presented as a held for sale asset as defined under IFRS 5. IFRS 5.23 states that the impairment loss recognised for a disposal group shall reduce the carrying amount of the non-current assets in the group that are within the scope of the measurement requirements of this IFRS, in the order of allocation set out in paragraphs 104(a) and (b) and 122 of IAS 36 (as revised in 2004). The impairment has been applied to goodwill first and then any residual impairment has been split proportionately between PPE, intangibles and ROU assets.
Estimate of contingent consideration
The sale of the CM business in July 2024 was on a contingent consideration basis to be paid in cash within 30 days of the first anniversary of Completion and is to be calculated by reference to the retainer and transaction revenue generated by the CM Division within the 12 months after Completion. This amount is to be the aggregate of 20% of the Retainer Fees, 30% of the Transaction Fees, 75% of the Market Making Equity Value and, subject to the Relevant Retainer Fees being equal to or greater than £2.75m, an amount equal to the Market Making Cash (£250k). Terms that are capitalised are defined in the relevant sale and purchase agreement dated 12 July 2024. The anniversary of completion has passed post year end and the consideration is confirmed to be £1.1m.This has been recognised fully as part of the gain on disposal in discontinued operations during the period.
Investments in subsidiaries
Where an indicator of impairment exists, management uses its judgement to assess the carrying value of the asset by determining the fair value by independent assessment of the carrying value of the business units. The carrying value of investments in subsidiaries, prior to impairment, on 31 March 2025 was £19.8m (FY24: £26.4m) (see note 15).The market capitalisation of WH Ireland Group Plc is £5.2m which is less than the £19.8m holding of WHI Ltd and Harpsden Ltd together, which could indicate an impairment.
At the year-ended 31 March 2025, the carrying values of the investments in subsidiaries were consequently assessed for indicators of impairment. The value of the investment in subsidiary has been measured as the same way as the WM CGU as this is the remaining trading element of WH Ireland Limited. The recoverable value of the WM CGU was calculated using the estimated sale price of £1m less disposal costs 0.5m.
WM was assessed with reference to the consideration for the disposal of the division which occurred post year end (see note 32).
The CGU was £0.5m, resulting in an impairment of £19.3m (note 15).
5. Segment information
The Group has previously had two principal operating segments, WM and CM and a number of central office costs that do not fall into either of these operating segments. At 31 March 2024 both of these operating segments met the criteria in IFRS 5 to be classified as discontinued operations (see note 6 & 32). During the year, the CM segment was sold and the WM segment met the criteria to be a discontinued operation and held for sale at 31 March 2025. This information has been disclosed to enable users of the financial statements to see the breakdown of the groups result from discontinued operations by segment.
WM offers investment management advice and services to individuals and contains our Wealth Planning business, giving advice on and acting as intermediary for a range of financial products. When operating, CM provided corporate finance and corporate broking advice and services to companies and acted as Nominated Adviser (Nomad) to clients traded on the AIM and contained an Institutional Sales and Research business, which carried out stockbroking activities on behalf of companies as well as conducting research into markets of interest to its clients.
Both divisions were located in the UK. Each reportable segment had a segment manager directly accountable to, and maintained regular contact with, the Chief Executive Officer.
No customer represented more than ten percent of the Group’s revenue (FY24: nil).
The following tables represent revenue and cost information for the Group’s business segments. The key line items below are not consistent with the statement of comprehensive income.
|
Year ended 31 March 2025 |
WM |
CM |
Central Office |
Group |
|
|
£’000 |
£’000 |
£’000 |
£’000 |
|
Revenue |
10,041 |
3,186 |
– |
13,227 |
|
Direct costs |
(7,912) |
(2,705) |
– |
(10,617) |
|
Contribution |
2,129 |
481 |
– |
2,610 |
|
Indirect costs* |
(4,002) |
(555) |
– |
(4,557) |
|
Underlying loss before tax |
(1,873) |
(74) |
– |
(1,947) |
|
Amortisation of acquired brand and client relationships |
(644) |
– |
– |
(644) |
|
Gains on fixed assets |
150 |
100 |
– |
250 |
|
Redundancy costs |
(332) |
(12) |
– |
(344) |
|
Holiday Leave paid on termination |
(12) |
– |
– |
(12) |
|
Project Costs |
(370) |
(146) |
– |
(516) |
|
Onerous contracts |
8 |
4 |
– |
12 |
|
Client settlement |
(9) |
(2) |
– |
(11) |
|
Investment losses |
– |
– |
99 |
99 |
|
Payaway on investment losses |
– |
(2) |
– |
(2) |
|
Impairment |
(6,113) |
|
|
(6,113) |
|
Loss before tax |
(9,195) |
(132) |
99 |
(9,228) |
|
Tax |
– |
– |
– |
– |
|
Loss for the year |
(9,195) |
(132) |
99 |
(9,228) |
*Includes £312k (FY24: £329k) auditor’s remuneration as follows:
Audit of these financial statements £80k (FY24: £80k)
Amounts payable to the principal auditors and their associates in respect of:
o audit of financial statements of subsidiaries pursuant to legislation £130k (FY24: £130k)
o audit related assurance services £77k (FY24: £59k)
o audit of financial statements relating to prior year £25k (FY24: £60k)
|
Year ended 31 March 2025 |
WM |
CM |
Group |
|
|
£’000 |
£’000 |
£’000 |
|
Statutory operating costs included the following: |
|
|
|
|
Amortisation (note 14) |
644 |
– |
644 |
|
Depreciation (note 12) |
133 |
– |
133 |
|
Depreciation from Right of Use assets (note 17) |
167 |
3 |
170 |
|
Year ended 31 March 2024 |
WM |
CM |
Central Office |
Group |
|
|
|
£’000 |
£’000 |
£’000 |
£’000 |
|
|
Revenue |
11,891 |
9,574 |
– |
21,465 |
|
|
Direct costs |
(9,628) |
(9,448) |
– |
(19,076) |
|
|
Contribution |
2,263 |
126 |
– |
2,389 |
|
|
Indirect costs* |
(2,894) |
(1,963) |
– |
(4,857) |
|
|
Underlying loss before tax |
(631) |
(1,837) |
– |
(2,468) |
|
|
Amortisation of acquired brand and client relationships |
(273) |
– |
– |
(273) |
|
|
Release of deferred consideration |
– |
– |
160 |
160 |
|
|
Redundancy costs |
(380) |
(564) |
– |
(944) |
|
|
Holiday Leave paid on termination |
(43) |
(83) |
– |
(126) |
|
|
Project Costs |
(865) |
(527) |
– |
(1,392) |
|
|
Onerous contracts |
– |
(447) |
– |
(447) |
|
|
Client settlement |
(152) |
– |
– |
(152) |
|
|
Investment losses |
– |
– |
(583) |
(583) |
|
|
Payaway on investment losses |
– |
274 |
– |
274 |
|
|
Loss before tax |
(2,344) |
(3,184) |
(423) |
(5,951) |
|
|
Tax |
– |
– |
12 |
12 |
|
|
Loss for the year |
(2,344) |
(3,184) |
(411) |
(5,939) |
|
The segment note has been restated to be consistent with the current year presentation.
|
Year ended 31 March 2024 |
WM |
CM |
Group |
|
|
£’000 |
£’000 |
£’000 |
|
Statutory operating costs included the following: |
|
|
|
|
Amortisation (note 14) |
273 |
– |
273 |
|
Depreciation (note 12) |
56 |
60 |
116 |
|
Depreciation from Right of Use assets (note 17) |
142 |
93 |
235 |
Segment assets and segment liabilities are reviewed by the Chief Executive Officer based on the consolidated statement of financial position. Accordingly, this information is replicated in the Group Consolidated statement of financial position on page 41 of the Annual Report. As no measure of assets or liabilities for individual segments is reviewed regularly by the Chief Executive Officer, no disclosure of total assets or liabilities has been made.
The accounting policies of the operating segments are the same as those described in the summary of significant accounting policies.
Revenue disaggregated by division and timing of recognition below:
|
Year ended 31 March 2025 |
WM |
CM |
Group |
|
|
£’000 |
£’000 |
£’000 |
|
Point in time |
1,043 |
2,210 |
3,253 |
|
Over time |
8,998 |
976 |
9,974 |
|
|
10,041 |
3,186 |
13,227 |
|
Year ended 31 March 2024 |
WM |
CM |
Group |
|
|
£’000 |
£’000 |
£’000 |
|
Point in time |
1,107 |
5,541 |
6,648 |
|
Over time |
10,784 |
4,033 |
14,817 |
|
|
11,891 |
9,574 |
21,465 |
The following movement of contract liabilities was recognised in the year:
|
|
As at 31 Mar 2024 |
Recognised in revenue |
Amounts deferred |
As at 31 Mar 2025 |
|
Group |
£’000 |
£’000 |
£’000 |
£’000 |
|
Contract liabilities |
14 |
(14) |
– |
– |
Contract liabilities relate to deferred recognition of retainer fees invoices quarterly. Contract assets relate to accrued management fee income and the decrease from £2.48m to £2.14m at 31 March 2025 is linked to the decrease in WM fee income for the period. Refer to note 19.
6. Discontinued operations and assets & liabilities held for sale
During the year, the CM division remained held for sale and was successfully sold in July 2024. The WM division was held for sale at 31 March 2024, however this was aborted on the 9th April and reclassified out of held for sale from that date (with depreciation and amortisation recognised from that date, including a catch up charge for the period it was previously held for sale). The WM division was subsequently reclassified as held for sale on by 31 March 2025. At this point amortisation and depreciation ceased again. The assets and liabilities that form the WM division has been assessed against the estimated fair value less cost of disposal and written down accordingly. An impairment of £6.1m has been recognised and is recorded in the Statement of Consolidated Income as part of the result from discontinued operations.
Financial performance information
|
|
|
Year ended |
Year ended |
|
|
|
31 Mar 2025 |
31 Mar 2024 |
|
|
Note |
£’000 |
£’000 |
|
Revenue |
|
13,227 |
21,465 |
|
Administrative expenses |
|
(22,768) |
(26,665) |
|
Expected credit loss |
19 |
(37) |
(328) |
|
Operating loss |
|
(9,578) |
(5,528) |
|
Gain on fixed assets |
|
250 |
– |
|
Other income |
|
1 |
– |
|
Taxation |
9 |
– |
– |
|
Post-tax (loss)/ profit from discontinuing operations |
|
(9,327) |
(5,528) |
The carrying amounts of assets and liabilities in the disposal group may be analysed as follows:
Assets and liabilities of disposal group classified as held for sale
|
|
|
WM |
|
CM |
Year ended 31 Mar 2025 |
WM |
CM |
Year ended 31 Mar 2024 |
|
Assets classified as held for sale |
Note |
£’000 |
|
£’000 |
£’000 |
£’000 |
£’000 |
£’000 |
|
Intangible assets |
14 |
621 |
|
– |
621 |
3,490 |
– |
3,490 |
|
Goodwill |
13 |
– |
|
– |
– |
3,539 |
– |
3,539 |
|
Property, plant and equipment |
12 |
51 |
|
– |
51 |
255 |
214 |
469 |
|
Investments – warrants* |
16 |
– |
|
30 |
30 |
– |
95 |
95 |
|
Right of use asset |
17 |
46 |
|
– |
46 |
378 |
23 |
401 |
|
Total assets held for sale |
|
718 |
|
30 |
748 |
7,662 |
332 |
7,994 |
*Relates to certain investments in warrant instruments that were not transferred upon disposal of the CM division but remain owned by the group.
|
|
|
Year ended |
Year ended |
|
Liabilities directly associated with assets classified as held for sale |
Note |
£’000 |
£’000 |
|
Lease liability |
17 |
(186) |
(293) |
|
Total liabilities held for sale |
|
(186) |
(293) |
|
|
Year ended |
Year ended |
|
|
£’000 |
£’000 |
|
Cash flows from operating activities |
(3,144) |
(5,306) |
|
Cash flows from investing activities |
1 |
(16) |
|
Cash flows from financing activities |
(119) |
(340) |
|
Total cash movement from discontinued activities |
(3,262) |
(5,662) |
7. Employee benefit expense
Non-salaried staff are commission-only brokers and therefore do not receive a salary.
|
|
Year ended |
Year ended |
|
|
31 Mar 2025 |
31 Mar 2024 |
|
Group |
£’000 |
£’000 |
|
Wages and salaries |
5,896 |
10,970 |
|
Bonuses |
1,054 |
618 |
|
Social security costs |
850 |
1,442 |
|
Other pension costs |
266 |
469 |
|
|
8,066 |
13,499 |
|
Non salaried staff |
697 |
1,592 |
|
Charge for share options granted to employees (note 29) |
441 |
338 |
|
|
9,204 |
15,429 |
|
|
|
|
|
|
Year ended |
Year ended |
|
|
31 Mar 2025 |
31 Mar 2024 |
|
Company |
£’000 |
£’000 |
|
Wages and salaries |
245 |
249 |
|
|
|
|
|
|
|
|
|
The average number of persons (including Directors) employed during the year was: |
|
|
|
|
|
|
|
|
Year ended |
Year ended |
|
Group |
31 Mar 2025 |
31 Mar 2024 |
|
Executive and senior management |
4 |
6 |
|
CM |
10 |
36 |
|
WM |
53 |
68 |
|
Support staff |
14 |
20 |
|
Salaried staff |
81 |
130 |
|
Non salaried staff |
3 |
3 |
|
Total |
84 |
133 |
|
|
|
|
|
|
Year ended |
Year ended |
|
Company |
31 Mar 2025 |
31 Mar 2024 |
|
Executive and senior management |
2 |
3 |
The total amount paid to Directors in the period, including social security costs was £1.1m (FY24: £0.8m). Full details of Directors’ remuneration, including that of the highest paid Director, are disclosed in the Remuneration Report on pages 29-31 of the Annual Report.
8. Finance income and expense
|
|
Year ended |
Year ended |
|
|
31 Mar 2025 |
31 Mar 2024 |
|
Group |
£’000 |
£’000 |
|
Bank interest receivable |
12 |
12 |
|
Finance income |
12 |
12 |
|
|
|
– |
|
|
|
|
|
Interest payable on lease liabilities classified within result from discontinued operations |
12 |
21 |
|
Release of deferred consideration (see note 23) |
– |
(160) |
|
Finance expense |
12 |
(139) |
9. Taxation
|
|
Year ended |
Year ended |
|
|
31 Mar 2025 |
31 Mar 2024
|
|
Group |
£’000 |
£’000 |
|
Current tax expense: |
|
|
|
United Kingdom corporation tax at 25% (FY24: 25%) |
– |
– |
|
Adjustment in respect of prior year |
|
(12) |
|
Total current tax |
– |
(12) |
|
|
|
|
|
Deferred tax credit (note 18): |
|
|
|
Current year |
– |
– |
|
Effect of change in tax rate |
– |
– |
|
Total deferred tax |
– |
– |
|
Total tax |
– |
(12) |
The tax credit for the year and the amount calculated by applying the standard United Kingdom corporation tax rate of 25% (FY24: 25%) to profit before tax can be reconciled as follows:
|
|
Year ended |
Year ended |
|
|
31 Mar 2025 |
31 Mar 2024 |
|
Group |
£’000 |
£’000 |
|
Loss before tax |
(9,228) |
(5,951) |
|
Tax expense using the United Kingdom corporation tax rate of 25% (FY24: 25%) |
(2,307) |
(1,488) |
|
Impairment charge not taxable |
1,528 |
|
|
Other expenses not tax deductible |
217 |
313 |
|
Movement in unrecognised deferred tax |
533 |
1,163 |
|
Other amounts |
29 |
– |
|
Total tax (credit) / charge |
– |
(12) |
10. Dividend
No dividend is proposed in respect of 2025 (FY24: none).
11. Earnings per share (EPS)
Basic EPS is calculated by dividing the profit or loss attributable to equity holders of the Company by the weighted average number of ordinary shares in issue during the year, excluding ordinary shares purchased by the Company (note 27).
Diluted EPS is the basic EPS, adjusted for the effect of the conversion into fully paid shares of the weighted average number of all employee share options outstanding. In a year when the Company presents positive earnings attributable to ordinary shareholders, anti-dilutive options represent options issued where the exercise price is greater than the average market price for the period.
Reconciliations of the earnings and weighted average number of shares used in the calculations are set out below:
|
|
Year ended |
Year ended |
|
|
31 Mar 2025 |
31 Mar 2024 |
|
Group |
|
|
|
Weighted average number of shares in issue during the period |
232,869 |
175,718 |
|
Effect of dilutive share options |
– |
– |
|
(thousands) |
|
|
|
|
232,869 |
175,718 |
|
|
|
|
|
Total |
|
|
|
Post-tax profit (loss) from continuing operations (£’000) |
99 |
(411) |
|
Loss from discontinuing operations incl. tax (£’000) |
(9,327) |
(5,528) |
|
Earning per share – basic and diluted |
|
|
|
From continuing operations |
0.04p |
(0.23p) |
|
From discontinuing operations |
(4.01p) |
(3.15p) |
|
Total |
(3.97p) |
(3.38p) |
12. Property, plant and equipment
|
|
Group |
|
Company |
|
|
Computers, |
|
Computers, |
|
|
fixtures and fittings |
|
fixtures and fittings |
|
|
£’000 |
|
£’000 |
|
Cost |
|
|
|
|
At 31 March 2023 |
6,223 |
|
37 |
|
Additions |
16 |
|
– |
|
Disposal |
– |
|
(4) |
|
Transfer to asset held for sale |
(6,239) |
|
– |
|
At 31 March 2024 |
– |
|
33 |
|
Transfer from asset held for sale |
6,239 |
|
– |
|
Additions |
10 |
|
– |
|
Impairment |
(4,241) |
|
– |
|
Disposal |
(170) |
|
– |
|
Transfer to asset held for sale |
(1,838) |
|
– |
|
At 31 March 2025 |
– |
|
33 |
|
|
|
|
|
|
Depreciation and impairment |
|
|
|
|
At 31 March 2023 |
5,654 |
|
33 |
|
Depreciation charge |
116 |
|
– |
|
Transfer to asset held for sale |
(5,770) |
|
– |
|
At 31 March 2024 |
– |
|
33 |
|
Transfer from asset held for sale |
5,770 |
|
– |
|
Impairment |
(4,057) |
|
– |
|
Disposal |
(59) |
|
– |
|
Depreciation charge |
133 |
|
– |
|
Transfer to asset held for sale |
(1,787) |
|
– |
|
At 31 March 2025 |
– |
|
33 |
|
|
|
|
|
|
Net book values |
|
|
|
|
At 31 March 2025 |
– |
|
– |
|
At 31 March 2024 |
– |
|
– |
Property, plant and equipment were transferred out of the WM disposal group on 9th April 2024, depreciation and catch up charges were recognised in the period to 31 January 2025 when the remaining Property, plant and equipment were reclassified to WM disposal group (note 6). Impairment has been recognised across the disposal group. The goodwill has been written off first, then the residual loss is allocated to other assets on a pro-rata basis according to their carrying amounts.
Included in the above, are software costs capitalised in the year with a net book value at 31 March 2025 of £1k (FY24: £9k).
13. Goodwill
Goodwill acquired in a business combination is allocated to a cash generating unit (CGU) that will benefit from that business combination. As explained in note 4, the goodwill is now attributed to the WM CGU.
The carrying amount of goodwill arising on the acquisition of Harpsden WM is set out below:
|
|
Year ended |
Year ended |
|
|
31 Mar 2025 |
31 Mar 2024 |
|
Group |
£’000 |
£’000 |
|
Beginning of year |
– |
3,539 |
|
Transfer back from asset held for sale |
3,539 |
– |
|
Impairment |
(3,539) |
– |
|
Transfer to asset held for sale |
– |
(3,539) |
|
End of year |
– |
– |
Goodwill is assessed annually for impairment and the recoverability has been assessed at 31 March 2025 by comparing the carrying value of the CGU to which the goodwill is allocated against its recoverable amount. The recoverable amount is the CGU’s fair value less cost to sell following the decision to sell the WM CGU. The fair value is best measured at the sale price of WM CGU which is £1m, less expected costs to sell of £0.5m.
The WM CGU recoverable amount was calculated as £0.5m, this is less than the carrying amount of £6.6m so an impairment has been recognised for £6.1m in total. The impairment was recognised first against the goodwill writing it down to £nil. Subsequently, the remaining impairment was apportioned against the other non-current assets within the CGU in accordance with IAS 36.
14. Intangible assets
Client relationships arise when the group acquires a broker business with an existing client base. The assets below represent the fair value of future benefits arising from these client relationships. Amortisation of client relationships is charged to administrative expenses in note 6 on a straight-line basis over the estimated useful lives (2 to 12 years).
|
|
Client |
|
|
|
|
relationships |
Brand |
Total |
|
Group |
£’000 |
£’000 |
£’000 |
|
Cost |
|
|
|
|
At 31 March 2023 |
8,731 |
75 |
8,806 |
|
Transfer to asset held for sale |
(8,731) |
(75) |
(8,806) |
|
At 31 March 2024 |
– |
– |
– |
|
Transfer from asset held for sale |
8,731 |
75 |
8,806 |
|
Impairment |
(2,225) |
– |
(2,225) |
|
Additions |
– |
– |
– |
|
Transfer to asset held for sale |
(6,506) |
(75) |
(6,581) |
|
At 31 March 2025 |
– |
– |
– |
|
|
|
|
|
|
Amortisation |
|
|
|
|
At 31 March 2023 |
4,968 |
75 |
5,043 |
|
Charge for the year |
273 |
– |
273 |
|
Transfer to asset held for sale |
(5,241) |
(75) |
(5,316) |
|
At 31 March 2024 |
– |
– |
– |
|
Transfer from asset held for sale |
5,241 |
75 |
5,316 |
|
Charge for the year |
644 |
– |
644 |
|
Transfer to asset held for sale |
(5,885) |
(75) |
(5,960) |
|
At 31 March 2024 |
– |
– |
– |
|
|
|
|
|
|
Net book values |
|
|
|
|
At 31 March 2025 |
– |
– |
– |
|
At 31 March 2024 |
– |
– |
– |
During the year ended 31 March 2021, the group acquired client relationships totalling £4.2m as part of the Harpsden acquisition and at the year ending 31 March 2025 the net book value was £0.6m (FY24: £3.25m) and remaining useful economic life of 6 years (FY24: 7 years). An intangible asset was also recognised representing the Harpsden brand totalling £75k and at the year ending 31 March 2025 the net book value was fully amortised.
An intangible asset was recognised relating to the client relationships brought in by Robert Race when he joined the group. At the year ended 31 March 2025 the net book value was £143k (FY24: £244k) and remaining useful economic life of 1 years (FY24: 2 years). The Harpsden and Robert Race client relationships total net book value comes to £621k after impairment.
Intangible assets were transferred out of the WM disposal group on 9th April 2024, amortisation and catch up charges were recognised in the period to 31 January 2025 when the remaining intangible assets were reclassified to WM disposal group (note 6). An impairment has been recorded for the WM CGU and is apportioned against the other non-current assets within the CGU in accordance with IAS 36. This includes the intangible assets, see note 13.
The company did not have any intangible assets either at 31 March 2025 or 31 March 2024.
15. Subsidiaries
|
|
|
Year ended |
Year ended |
|
|
Note |
31 Mar 2025 |
31 Mar 2024 |
|
Company |
|
£’000 |
£’000 |
|
Beginning of year |
|
19,848 |
26,448 |
|
Impairment |
4 |
(19,316) |
(6,600) |
|
End of year |
|
532 |
19,848 |
Investments in subsidiaries are stated at cost less impairment.
The Company’s subsidiaries, all of which are included in the consolidated financial statements, are presented below:
|
Subsidiary |
Country of incorporation |
Principal activity |
Class of shares |
Proportion held by Group |
Proportion held by Company |
|
WH Ireland Limited |
England & Wales |
WM and CM |
Ordinary |
100% |
100% |
|
Harpsden WM Limited |
England & Wales |
WM |
Ordinary |
100% |
100% |
|
WH Ireland (Financial Services) Limited |
England & Wales |
Dormant |
Ordinary |
100% |
– |
|
Readycount Limited |
England & Wales |
Dormant |
Ordinary |
100% |
100% |
|
Stockholm Investments Limited |
England & Wales |
Dormant |
Ordinary |
100% |
100% |
|
ARE Business and Professional Limited |
England & Wales |
Dormant |
Ordinary |
100% |
– |
|
SRS Business and Professional Limited |
England & Wales |
Dormant |
Ordinary |
100% |
– |
|
WH Ireland Nominees Limited |
England & Wales |
Nominee |
Ordinary |
100% |
– |
|
WH Ireland Trustee Limited |
England & Wales |
Trustee |
Ordinary |
100% |
– |
|
Fitel Nominees Limited |
England & Wales |
Nominee |
Ordinary |
100% |
– |
The registered office of all companies listed above is 24 Martin Lane, London, EC4R 0DR.
The following dormant subsidiaries are guaranteed by the Company and therefore take advantage of the Companies Act (2006) in obtaining exemption from an individual audit:
|
Subsidiary |
Country of incorporation |
Company registration number |
|
WH Ireland (Financial Services) Limited |
England & Wales |
4279349 |
|
Readycount Limited |
England & Wales |
3164863 |
|
Stockholm Investments Limited |
England & Wales |
4215675 |
|
ARE Business and Professional Limited |
England & Wales |
3681185 |
|
SRS Business and Professional Limited |
England & Wales |
4238969 |
|
WH Ireland Nominees Limited |
England & Wales |
2908691 |
|
WH Ireland Trustee Limited |
England & Wales |
3559373 |
|
Fitel Nominees Limited |
England & Wales |
1401140 |
16. Investments
|
Group |
|
|
|
|
Warrants |
Total |
|
Other financial assets at fair value through profit or loss |
£’000 |
£’000 |
|
At 31 March 2023 |
820 |
820 |
|
Additions |
184 |
184 |
|
Fair value loss |
(597) |
(597) |
|
Disposals |
(312) |
(312) |
|
Transfer to asset held for sale |
(95) |
(95) |
|
At 31 March 2024 |
– |
– |
|
Transfer from asset held for sale |
95 |
95 |
|
Additions |
22 |
22 |
|
Fair value loss |
(60) |
(60) |
|
Disposals |
(27) |
(27) |
|
Transfer to asset held for sale |
(30) |
(30) |
|
At 31 March 2025 |
– |
– |
|
|
|
|
|
Total investments at 31 March 2025 |
– |
– |
|
Total investments at 31 March 2024 |
– |
– |
Financial assets at fair value through profit or loss include equity investments other than those in subsidiary undertakings. These are measured at fair value with fair value gains and losses recognised through profit and loss.
Other investments, in the main, comprise financial assets designated as fair value through profit or loss and include warrants.
Warrants may be received during the ordinary course of business and are designated as fair value through profit or loss. There is no cash consideration associated with the acquisition.
The fair value of the warrants was determined using the Black Scholes model and grouped within level 3 with fair value measurements derived from formal valuation techniques (see note 25). The key inputs into this calculation are the share price as at 31 March 2025, exercise price, risk free interest rate and volatility which is based on the share price movements during the same length as the remaining time of exercise.
|
|
|
Year ended |
Year ended |
|
|
|
31 Mar 2025 |
31 Mar 2024 |
|
Net loss on investments |
Note |
£’000 |
£’000 |
|
Fair value loss on warrants |
|
(84) |
(597) |
|
Fair value gain / (loss) on investments |
20 |
183 |
14 |
|
Total net loss on investments |
|
99 |
(583) |
|
17. Right of use asset and lease liability
|
|
Leasehold Properties |
|
|
£’000 |
|
Cost |
|
|
At 31 March 2023 |
2,052 |
|
Transferred to asset held for sale |
(2,052) |
|
At 31 March 2024 |
– |
|
Transferred from asset held for sale |
2,052 |
|
Impairment |
(165) |
|
Transferred to asset held for sale |
(1,887) |
|
At 31 March 2025 |
– |
|
|
|
|
Depreciation and impairment |
|
|
At 31 March 2023 |
1,417 |
|
Charge for the year |
235 |
|
Transferred to asset held for sale |
(1,652) |
|
At 31 March 2024 |
– |
|
Transferred from asset held for sale |
1,652 |
|
Charge for the year |
170 |
|
Disposal |
20 |
|
Transfer to asset held for sale |
(1,842) |
|
At 31 March 2025 |
– |
|
|
|
|
Net book values |
|
|
At 31 March 2025 |
– |
|
At 31 March 2024 |
– |
Maturity of discounted lease payments in relation to non-cancellable leases
The table below represents the minimum lease payments in relation to non-cancellable leases where the group is a lessee:
|
|
Group |
|||
|
|
Payable within 1 year |
Payable in 2 to 5 years |
Payable after more than 5 years |
Total contractual payments |
|
Group |
£’000 |
£’000 |
£’000 |
£’000 |
|
2025 |
85 |
101 |
– |
186 |
|
2024 |
97 |
196 |
– |
293 |
The leases were transferred to the WM disposal group on 31 January 2025, and in prior year WM and CM disposal groups on 31 October 2023 and 15 February 2024 respectively.
The following represents the lease expense in relation to leases which is recognised in the statement of comprehensive income:
|
|
Year ended |
Year ended |
|
|
31 Mar 2025 |
31 Mar 2024 |
|
Group |
£’000 |
£’000 |
|
Depreciation of right of use asset |
170 |
235 |
|
Interest charge |
12 |
21 |
|
Total charge |
182 |
256 |
Nature of leases
The Group leases a number of properties in the UK.
These leases are usually for a fixed term although the Group sometimes negotiates break clauses in its leases. On a case-by-case basis, the Group will consider whether the absence of a break clause would expose the group to excessive risk. Typically factors considered in deciding to negotiate a break clause include:
· the length of the lease term;
· the economic stability of the environment in which the property is located; and
· whether the location represents a new area of operations for the Group
As at 31 March 2025, the carrying amounts of the lease liabilities are not reduced by the amounts that would not be paid as a result of exercising the break clauses because the Group does not anticipate exercising its rights to the break clauses.
The total cash outflow for leases, including short-term leases, in the year ending 31 March 2025 was £119k (FY24: £340k)
Payments associated with short-term leases and all leases of low-value assets are recognised on a straight-line basis in administrative expenses in note 6. Short-term leases are leases with a lease term of 12 months or less without a purchase option, short term leases recorded as an expense during the year was £368k (FY24: £115k).
The Company did not have any right of use assets or lease liabilities either at 31 March 2025 or 31 March 2024.
18. Deferred tax assets and liabilities
Deferred tax is provided for temporary differences, at the reporting year-end date, between the tax bases of assets and liabilities and their carrying amounts for financial reporting purposes using a tax rate of 25% (FY24: 25%). A deferred tax asset is recognised for all deductible temporary differences and unutilised tax losses only to the extent that it is probable that future taxable profits will be available against which the assets can be utilised. Deferred tax assets are reduced to the extent that it is no longer probable that the related tax benefit will be realised.
As the intangible assets to which the deferred tax liability was previously recognised against have been impaired during the year (see note 14) and the decision has been taken to initiate the orderly winding up of the group (see Non-going concern basis of preparation in note 1), the deferred tax liability and associated deferred tax asset for trading losses have been derecognised at 31 March 2025. The net impact of this is nil deferred tax charge or credit and nil carrying value at 31 March 2025.
|
Year ended 31 March 2025 |
Asset |
Liability |
Net |
|
Business Combinations |
– |
– |
– |
|
Trading losses carried forward |
– |
– |
– |
|
Deferred tax asset/ (liability) |
– |
– |
– |
|
Set off |
– |
– |
– |
|
Net deferred tax asset/ (liability) |
– |
– |
– |
|
|
|
|
|
|
Year ended 31 March 2024 |
Asset |
Liability |
Net |
|
Business Combinations |
– |
(596) |
(596) |
|
Trading losses carried forward |
596 |
– |
596 |
|
Deferred tax asset/ (liability) |
596 |
(596) |
– |
|
Set off |
(596) |
596 |
– |
|
Net deferred tax asset/ (liability) |
– |
– |
– |
19. Trade and other receivables
|
|
Group |
Company |
||
|
|
31 Mar 2025 |
31 Mar 2024 |
31 Mar 2025 |
31 Mar 2024 |
|
|
£’000 |
£’000 |
£’000 |
£’000 |
|
Non-current assets |
|
|
|
|
|
Amounts owed from Group companies |
– |
– |
4,050 |
4,676 |
|
Current assets |
|
|
|
|
|
Trade receivables |
82 |
508 |
– |
– |
|
Other receivables |
1,186 |
874 |
15 |
26 |
|
Contract assets |
2,208 |
2,481 |
– |
– |
|
Prepayments |
301 |
1,235 |
– |
18 |
|
|
3,777 |
5,098 |
15 |
44 |
The carrying value of trade and other receivable balances are denominated fully in British pounds (FY24: 100%).
Contract assets relates to management fee accruals. Management fees are accrued on a monthly basis and reconciled to fees collected quarterly. Consideration to IFRS 9 has been made and it has been determined that there is a low probability of default and therefore the expected credit loss is not material.
The impact of applying IFRS 9 to intercompany balances for the Company has been considered and probability of default was assessed and consequently, it was determined that the probability of default was low as WH Ireland has current assets that could be used to satisfy the intercompany balance.
Fees and charges owed by clients are generally considered to be past due where they remain unpaid five working days after the relevant billing date. At 31 March 2025, trade receivables (net of provisions for impairment and doubtful debts) comprised of the following:
|
|
Group |
Company |
||
|
|
31 Mar 2025 |
31 Mar 2024 |
31 Mar 2025 |
31 Mar 2024 |
|
|
£’000 |
£’000 |
£’000 |
£’000 |
|
Not past due |
– |
61 |
– |
– |
|
Up to 5 days due |
– |
– |
– |
– |
|
from 6 to 15 days past due |
– |
12 |
– |
– |
|
From 16 to 30 days past due |
– |
6 |
– |
– |
|
From 31 to 45 days past due |
– |
43 |
– |
– |
|
More than 45 days past due |
82 |
386 |
– |
– |
|
|
82 |
508 |
– |
– |
Trade receivables are largely amounts due from retainer clients, who are invoiced on a quarterly basis in advance. The Group’s payment terms are set out in each client’s engagement letter (with a maximum of 30 days). Consequently, these receivables have no significant financing component and the Group have applied the simplified approach in line with IFRS 9. Calculation of loss allowances are measured at an amount equal to lifetime expected credit losses (ECLs). The approach taken by the Group in arriving at the expected credit loss is as follows:
Step 1: The Group have determined the appropriate brackets by grouping each trade receivables based on the ageing structure.
Step 2: Having determined the appropriate groupings, a historical loss rate (adjusted for forward looking information) was calculated for each age bracket by reviewing the pattern of payment of trade receivables over the past 12 months.
Step 3: This historical loss rate (adjusted for forward looking information) has been applied to each ageing bracket of trade receivables as at the balance sheet date to arrive at an expected credit loss for each grouping. All trade receivables over 365 days have a 100% historical loss rate loss applied to them.
Based on the above, the group recognised an expected credit loss of £37k (FY24: £328k expected credit loss).
The maximum exposure to credit risk, before any collateral held as security, is the carrying value of each class of receivable set out above.
The Directors consider that the carrying amounts of trade and other receivables approximate their fair value.
Movements in impairment provisions were as follows:
|
|
Group |
Company |
||
|
|
31 Mar 2025 |
31 Mar 2024 |
31 Mar 2025 |
31 Mar 2024 |
|
|
£’000 |
£’000 |
£’000 |
£’000 |
|
Opening balance |
455 |
248 |
– |
– |
|
Amount released from provision due to recovery |
(59) |
(66) |
– |
– |
|
Amounts written off, previously fully provided |
(39) |
(121) |
– |
– |
|
Amount charged to the statement of comprehensive income |
95 |
394 |
– |
– |
|
Closing balance |
452 |
455 |
– |
– |
20. Other investments
|
|
Group |
Company |
|||
|
|
31 Mar 2025 |
31 Mar 2024 |
|
31 Mar 2025 |
31 Mar 2024 |
|
|
£’000 |
£’000 |
|
£’000 |
£’000 |
|
Current asset investment |
84 |
671 |
|
– |
– |
|
Restricted cash |
– |
873 |
|
– |
– |
|
Total |
84 |
1,544 |
|
– |
– |
Current asset investments represent short-term principal positions in the form of listed and unquoted investments which are held at market value.
Included in current asset investments are unquoted investments totalling a value of £nil (FY24: £nil).
Restricted cash represents monies held by the Group which have some restrictions on their conversion to cash. The cash was held by an external broker which has restrictions on cash in order to comply with margin requirements.
Included in net loss on investments, in the Consolidated statement of comprehensive income is the fair value gain and the sale of investments. Further details can be found in note 16.
Fair value, in the case of quoted investments, represents the bid price at the reporting year-end date. In the case of unquoted investments, the fair value is estimated by reference to recent arm’s length transactions. The fair value of warrants is estimated using established valuation models.
21. Cash and cash equivalents
|
|
Group |
Company |
||
|
|
31 Mar 2025 |
31 Mar 2024 |
31 Mar 2025 |
31 Mar 2024 |
|
|
£’000 |
£’000 |
£’000 |
£’000 |
|
Cash and cash equivalents |
3,459 |
4,902 |
– |
– |
For the purposes of the cash flow statement, cash and cash equivalents comprise cash in hand and deposits with banks and financial institutions with a maturity of up to three months.
Cash and cash equivalents represent the Group’s and the Company’s money and money held for settlement of outstanding transactions.
Money held on behalf of clients is not included in cash and cash equivalents on the statement of financial position. Client money at 31 March 2025 for the Group was £139k (FY24: £137k). There is no client money held in the Company (FY24: £nil).
22. Trade and other payables
|
|
Group |
Company |
||
|
|
31 Mar 2025 |
31 Mar 2024 |
31 Mar 2025 |
31 Mar 2024 |
|
|
£’000 |
£’000 |
£’000 |
£’000 |
|
Trade payables |
491 |
1,210 |
12 |
226 |
|
Amounts due to Group companies |
– |
– |
382 |
312 |
|
Other payables |
145 |
192 |
– |
– |
|
Tax and social security |
56 |
289 |
– |
– |
|
Contract liabilities |
– |
14 |
– |
– |
|
Accruals |
1,272 |
1,527 |
135 |
212 |
|
|
1,964 |
3,232 |
529 |
750 |
The Directors consider that the carrying amounts of trade and other payables approximate their fair value.
Deferred income relates to retainer fees invoiced in advance and spread over the length of the period, typically quarterly. The balance at year-end was fully recognised in the following financial year.
Amounts due to Group companies are unsecured, interest free and repayable on demand.
23. Provisions
|
|
Group |
Company |
||||||
|
|
Deferred consi- deration |
Provision for onerous contracts |
Other provision |
£’000 |
Deferred consi- deration |
Other provision |
£’000 |
|
|
At 31 March 2023 |
2,121 |
– |
– |
2,121 |
2,121 |
– |
2,121 |
|
|
(Credited)/charged to Statement of Comprehensive Income |
(160) |
447 |
– |
287 |
(160) |
– |
(160) |
|
|
Reclassification |
(354) |
– |
354 |
– |
(354) |
354 |
– |
|
|
Paid during the year |
(78) |
– |
– |
(78) |
(78) |
– |
(78) |
|
|
Settled during the year via share issue |
(654) |
– |
– |
(654) |
(654) |
– |
(654) |
|
|
At 31 March 2024 |
875 |
447 |
354 |
1,676 |
875 |
354 |
1,229 |
|
|
Charged to Statement of Comprehensive Income |
– |
(433) |
– |
(433) |
– |
– |
– |
|
|
Settled per agreement |
(875) |
– |
– |
(875) |
(875) |
– |
(875) |
|
|
At 31 March 2025 |
– |
14 |
354 |
368 |
– |
354 |
354 |
|
Provisions of £368k (2024: £1,676k) are included in current liabilities.
Deferred consideration relates to the acquisition of Harpsden and the maximum amounts payable over a two-year period. The following assumptions were made: revenue growth of 2%, attrition rate of 3% for larger clients and 10% for smaller clients, discount rate of 13.5%.
During the year a final payment of £875k was paid to former shareholders of Harpsden WM Limited (Harpsden) in relation to the deferred consideration due. The remaining excess provision of £354k has been retained by the Group and reclassified to other provisions on account of potential future claims that may arise.
As part of the sale of the CM division there were existing contracts that ran until December 2024. These services were not used by the business so are included in the discontinued operations for CM. These are onerous contracts as the Group was locked into them and were not transferred to the buyer.
24. Financial risk management
The fair value of all the Group’s and the Company’s financial assets and liabilities approximated to their carrying value at the reporting year-end date. The carrying amount of non-current financial instruments, including floating interest rate borrowing, are not significantly different from the fair value of these instruments based on discounted cash flows. The significant methods and assumptions used in estimating fair values of financial instruments are summarised below:
Financial assets at fair value through profit or loss
Financial assets at fair value through profit or loss include equity investments, other than those in subsidiary undertakings. In the case of listed investments, the fair value represents the quoted bid price at the reporting period end date. The fair value of unlisted investments is estimated by reference to recent arm’s length transactions.
Other investments
Other investments include warrants and equity investments, categorised as fair value through profit or loss. In the case of listed investments, the fair value represents the quoted bid price at the reporting year-end date. The fair value of unlisted investments is estimated by reference to recent arm’s length transactions. In the case of warrants, the fair value is estimated using established valuation models.
Trade receivables and payables
The carrying value less impairment provision of trade receivables and payables is assumed to approximate to their fair values due to their short-term nature.
Borrowings
Borrowings are measured at amortised cost using the effective interest rate method. The tables below summarise the Group’s main financial instruments by financial asset type:
|
|
|
31 March 2025 |
||||
|
|
|
Amortised cost |
Fair value through profit or loss |
Total |
||
|
Group |
Note |
£’000 |
£’000 |
£’000 |
||
|
Financial assets |
|
|
|
|
||
|
Other investments |
16, 20 |
– |
114 |
114 |
||
|
Trade and other receivables |
19 |
3,476 |
– |
3,476 |
||
|
Cash and cash equivalents |
21 |
3,459 |
– |
3,459 |
||
|
Financial liabilities |
|
|
|
|
||
|
Trade and other payables |
22 |
1,908 |
– |
1,908 |
||
|
Lease liability |
17 |
186 |
– |
186 |
||
|
|
|
31 March 2024 |
|||
|
|
|
Amortised cost |
Fair value through profit or loss |
Total |
|
|
Group |
Note |
£’000 |
£’000 |
£’000 |
|
|
Financial assets |
|
|
|
|
|
|
Other investments |
16, 20 |
– |
1,639 |
1,639 |
|
|
Trade and other receivables |
19 |
3,863 |
– |
3,863 |
|
|
Cash and cash equivalents |
21 |
4,902 |
– |
4,902 |
|
|
Financial liabilities |
|
|
|
|
|
|
Trade and other payables |
22 |
2,929 |
– |
2,929 |
|
|
Deferred consideration |
23 |
875 |
– |
875 |
|
|
Lease Liability |
17 |
293 |
– |
293 |
|
The tables below summarise the Company’s main financial instruments by financial asset type:
|
|
|
31 March 2025 |
||
|
|
|
Amortised cost |
Fair value through profit or loss |
Total |
|
Company |
Note |
£’000 |
£’000 |
£’000 |
|
Financial assets |
|
|
|
|
|
Trade and other receivables |
19 |
15 |
– |
15 |
|
Amounts owed from Group companies |
|
4,050 |
|
4,050 |
|
Financial liabilities |
|
|
|
|
|
Trade and other payables |
22 |
147 |
– |
147 |
|
Amounts due to Group companies |
22 |
382 |
– |
382 |
|
|
|
31 March 2024 |
||
|
|
|
Amortised cost |
Fair value through profit or loss |
Total |
|
Company |
Note |
£’000 |
£’000 |
£’000 |
|
Financial assets |
|
|
|
|
|
Trade and other receivables |
19 |
26 |
– |
26 |
|
Amounts owed from Group companies |
|
4,676 |
– |
4,676 |
|
Cash and cash equivalents |
21 |
– |
– |
– |
|
Financial liabilities |
|
|
|
|
|
Trade and other payables |
22 |
438 |
– |
438 |
|
Amounts due to Group companies |
22 |
312 |
– |
312 |
Risks
The main risks arising from the Group’s financial instruments are credit risk, liquidity risk and market risk. Market risk comprises, interest rate risk and other price risk. The Directors review and agree policies for managing each of these risks which are summarised below:
Credit risk
Credit risk is the risk that clients or other counterparties to a financial instrument will cause a financial loss by failing to meet their obligations. Credit risk relates, in the main, to the Group’s trading and investment activities and is the risk that third parties fail to pay amounts as they fall due. Formal credit procedures include approval of client limits, approval of material trades, collateral in place for trading clients and chasing of overdue accounts. Additionally, risk assessments are performed on banks and custodians.
The maximum exposure to credit risk at the end of the reporting period is equal to the statement of financial position figure. The impairment policy can be found in note 19. There were no other past due, impaired or unsecured debtors.
Financial assets that are neither past due nor impaired in respect of trade receivables relate mainly to accrued management fees.
The credit risk on liquid funds, cash and cash equivalents is limited due to deposits being held at the Group’s main bank with a credit rating of “A”, assigned by Standard and Poor’s.
There has been no change to the Group’s exposure to credit risk or the manner in which it manages and measures the risk during the period.
The credit risk in the Company principally comes from intercompany balances and subordinated loan. Since these are all within the Group, the Directors can closely monitor the risk of default on a regular basis to minimise any potential losses.
Liquidity risk
Liquidity risk is the risk that obligations associated with financial liabilities will not be met. The Group monitors its risk to a shortage of funds by considering the maturity of both its financial investments and financial assets (for example, trade receivables) and projected cash flows from operations.
The Group’s objective is to maintain the continuity of funding using bank facilities where necessary, which are reviewed annually with the Group’s Banker, the Bank of Scotland. Items considered are limits in place with counterparties which the bank are required to guarantee, payment facility limits, as well as the need for any additional borrowings.
The table below summarises the maturity profile of the Group’s financial liabilities based on contractual undiscounted payments:
|
|
|
31 March 2025 |
|||
|
|
|
Payable within 1 year |
Payable in 2 to 5 years |
Payable after more than 5 years |
Total contractual payments |
|
Group |
Note |
£’000 |
£’000 |
£’000 |
£’000 |
|
Trade and other payables |
22 |
1,908 |
– |
– |
1,908 |
|
Lease liability |
6,17 |
186 |
– |
– |
186 |
|
|
|
2,094 |
– |
– |
2,094 |
|
|
|
31 March 2024 |
|||||
|
|
|
Payable within 1 year |
Payable in 2 to 5 years |
Payable after more than 5 years |
Total contractual payments |
||
|
Group |
Note |
£’000 |
£’000 |
£’000 |
£’000 |
||
|
Trade and other payables |
22 |
2,929 |
– |
– |
2,929 |
||
|
Lease liability |
6,17 |
110 |
210 |
– |
320 |
||
|
Deferred consideration |
23 |
875 |
– |
– |
875 |
||
|
|
|
3,914 |
210 |
– |
4,124 |
||
The table below summarises the maturity profile of the Company’s financial liabilities based on contractual undiscounted payments:
|
|
31 March 2025 |
|||
|
|
Payable within 1 year |
Payable in 2 to 5 years |
Payable after more than 5 years |
Total contractual payments |
|
Company |
£’000 |
£’000 |
£’000 |
£’000 |
|
Trade and other payables |
147 |
– |
– |
147 |
|
|
31 March 2024 |
|||
|
|
Payable within 1 year |
Payable in 2 to 5 years |
Payable after more than 5 years |
Total contractual payments |
|
Company |
£’000 |
£’000 |
£’000 |
£’000 |
|
Trade and other payables |
438 |
– |
– |
438 |
Market Risk
Interest rate risk
The Group’s exposure to the risk of changes in market interest rates relates to the Group’s amount of interest receivable on cash deposits. The maximum exposure for interest is not significant.
Other price risk
Other price risk is the risk that the fair value or future cash flows of a financial instrument will fluctuate because of changes in market prices (other than those arising from interest rate risk) whether those changes are caused by factors specific to the individual financial instrument or its issuer or factors affecting all similar financial instruments traded in the market. Other investments are recognised at fair value and subject to changes in market prices.
The Group manages other price risk by monitoring the value of its financial instruments monthly and reporting these to the Directors and Senior Management. The Group has disposed of several of its investments during the year, which has helped mitigate risk. However, the risk of deterioration in prices remains high whilst the market continues to be volatile.
The risk of future losses is limited to the fair value of investments as at the year-end of £114k (FY24: £1,639k). See note 16 and 20.
Fair value measurement recognised in the statement of financial position
The following table provides an analysis of financial instruments that are measured after initial recognition at fair value, grouped into Levels 1 to 3 based on the degree to which the fair value is observable:
· Level 1 at fair value measurements are those derived from quoted prices (unadjusted) in active markets for identical assets and liabilities;
· Level 2 fair value measurements are those derived from inputs other than the quoted price included within Level 1 that are observable for the asset or a liability, either directly (i.e. as prices) or indirectly (i.e. derived from prices); and
· Level 3 fair value measurements are those derived from formal valuation techniques that include inputs for the asset or liability that are not based on observable market data (unobservable inputs). The valuation technique used in determining the fair value is the Black Scholes model. The key inputs into this calculation are the share price as at 31 March 2024, exercise price, risk free interest rate and share price volatility.
|
|
31 March 2025 |
|||
|
|
Level 1 |
Level 2 |
Level 3 |
Total |
|
|
£’000 |
£’000 |
£’000 |
£’000 |
|
Financial assets at fair value through profit or loss |
|
|
|
|
|
Unquoted equities |
– |
– |
– |
– |
|
Financial instruments designated at fair value through profit or loss |
|
|
|
|
|
Other investments (note 16 & 20) |
84 |
– |
30 |
114 |
|
Total |
84 |
– |
30 |
114 |
|
|
31 March 2024 |
|||
|
|
Level 1 |
Level 2 |
Level 3 |
Total |
|
|
£’000 |
£’000 |
£’000 |
£’000 |
|
Financial assets at fair value through profit or loss |
|
|
|
|
|
Unquoted equities |
– |
– |
– |
– |
|
Financial instruments designated at fair value through profit or loss |
|
|
|
|
|
Other investments (note 16 & 20) |
1,544 |
– |
95 |
1,639 |
|
Total |
1,544 |
– |
95 |
1,639 |
25. Capital management
The capital of the Group comprises share capital, share premium, retained earnings and other reserves. The total capital at 31 March 2025 amounted to £11.7m for the Group (FY24: £14.3m) and £24.1m for the Company (FY24: £23.7m). The primary objective of the Group’s capital management is to ensure that it maintains a strong capital structure to support the development of its business, to maximise shareholder value and to provide benefits for its other stakeholders.
These objectives are met by managing the level of debt and setting dividends paid to shareholders at a level appropriate to the performance of the business.
Certain activities of the Group are regulated by the FCA which is the statutory regulator for financial services business and has responsibility for policy, monitoring and discipline for the financial services industry. The FCA requires the Group’s resources to be adequate, that is, sufficient in terms of quantity, quality and availability, in relation to its regulated activities.
The Group monitors capital on a daily basis by measuring movements in the Group regulatory capital requirement and through its Internal Capital Adequacy and Risk Assessment Process (ICARA), which was formerly through its Internal Capital Adequacy Assessment Process (ICAAP). Compliance with FCA minimum common equity tier 1 regulatory capital requirements was maintained during the year and the Group is satisfied that there is and will be, sufficient capital to meet these regulatory requirements for the foreseeable future.
26. Share capital and share premium account
|
|
Number of shares |
|
Share |
|
|
Ordinary shares |
Ordinary shares |
Deferred shares |
Share capital |
premium |
|
|
000’s |
000’s |
£’000 |
£’000 |
|
As at 1 April 2023 |
62,311 |
– |
3,116 |
19,014 |
|
Shares issued: |
|
|
|
|
|
To settle deferred consideration |
2,842 |
– |
142 |
511 |
|
Share split |
– |
65,153 |
– |
3,417 |
|
On placing |
170,833 |
– |
1,707 |
(125) |
|
Balance at 31 March 2024 |
235,986 |
65,153 |
4,965 |
22,817 |
|
|
|
|
|
|
|
Balance at 31 March 2025 |
235,986 |
65,153 |
4,965 |
22,817 |
The total number of ordinary shares in issue is 235.99 million of 1p each (31 March 2024: 235.99 million of 1p each). The total number of deferred shares is 65.15 million (31 March 2024: 65.15 million) of 4p each.
During the prior year the group undertook a share placing, which raised net proceeds of £5m by way of 170,833,333 ordinary shares at a price of 3p. The placing took place on 28 July 2023 and funds were received in August 2023. This decision was taken after discussions with the FCA.
In order to permit the Placing Shares to be issued at the Placing Price, which was lower than the nominal value of the Existing Ordinary Shares, the Company divided each issued Existing Ordinary Share (nominal value 5p each) into one New Ordinary Share (nominal value 1p each) and one Deferred Share (nominal value 4p each). The New Ordinary Shares have the same rights and benefits as the Existing Ordinary Shares. Following the Share Sub-division, the number of New Ordinary Shares held by each Shareholder were the same as the number of Existing Ordinary Shares held by them immediately before the Share Sub-division. The Deferred Shares were not admitted to trading on AIM, have only very limited rights on a return of capital and are effectively valueless and non-transferable. As a result of the Share Sub-division, the Company adopted the New Articles, which set out the rights and restrictions applicable to the New Ordinary Shares and the New Deferred Shares.
27. Treasury shares
|
|
Year ended 31 March 2025 |
Year ended 31 March 2024 |
|
Group |
£’000 |
£’000 |
|
At 31 March |
1,114 |
1,093 |
|
Additions |
– |
21 |
|
At 31 March |
1,114 |
1,114 |
At 31 March 2025 no shares in the Company were held in the EBT (FY24: nil shares) and the ESOT held 3,117,418 shares (FY24: 3,117,418), at a nominal value of 1p per share and represents the full balance above. This represents 1.32% of the called up share capital (FY24: 1.32%).
The company loaned the amount required for the ESOT to purchase the shares as required. During the year, the company loan receivable has been written down to the recoverable value of the shares as at 31 March 2025 of £79k (2024: £1,114k).
During the prior year the Company’s Employee Share Option trust (ESOT) purchased the following ordinary shares in the Company:
|
|
Number of shares |
Nominal value |
Total consideration |
|
Date of issue |
000’s |
£’000 |
£’000 |
|
20-Apr-23 |
50,000 |
5p |
9,500 |
|
12-Jun-23 |
10,000 |
5p |
2,310 |
|
20-Jun-23 |
40,000 |
5p |
9,240 |
28. Employee Benefit Trusts (EBT)
The WH Ireland EBT was established in October 1998 and the WH Ireland Group plc Employee Share Ownership Trust (ESOT) was established in October 2011, both for the purpose of holding and distributing shares in the Company for the benefit of the employees. All costs of the EBT and ESOT are borne by the Company or its subsidiary WH Ireland Limited.
Joint Ownership Arrangements (the ‘JOE Agreements’) are in place in relation to 400,000 shares between the trustees of the ESOT and a number of employees (the ‘Employees’). Under the JOE Agreements, the option for the Employees to acquire the interest that the trustees of the ESOT has in the jointly owned shares, lapses when an employee is deemed to be a Bad Leaver. If an Employee ceases to be an employee of the Group, other than in the event of critical illness or death, the Employee is deemed to be a Bad Leaver.
The shares carry dividend and voting rights though these have been waived by all parties to the JOE Agreements. Due to the consolidation of the ESOT into the Group accounts, these shares are shown in Treasury (note 27). Due to the nature of these arrangements, the options contained in the JOE Agreements are accounted for as share-based payments (note 29).
29. Share-based payments
The Group had two schemes for the granting of non-transferable options to employees during the reporting period; the approved Company Share Ownership Plan (CSOP) and a Save as You Earn Schemes (SAYE). In addition, options are held in the ESOT (note 28). Details of these schemes can be found in the Remuneration Report on pages 29 to 31 of the Annual Report. SAYE matures in July 2025.
Company Share Ownership Plan (CSOP)
Under the terms of the Unapproved Options, options over the Company’s shares may be granted on a discretionary basis to employees and consultants of the Group (including Directors) at a price to be agreed between the Company and the relevant option holder. Under the terms of the options granted, such options vest on the third anniversary of the award dates; are exercisable at the market price at the time the option was issued and are exercisable for ten years after the vesting date.
Salary Sacrifice Scheme
During the year, directors agreed to sacrifice a proportion of their respective salaries in consideration of being awarded with options to subscribe, at nil cost, for a number of New Ordinary Shares, with such options vesting on a monthly basis over such period and (subject to vesting) which may be exercised in the period of ten years following the date of vesting. Vesting is subject to their remaining an employee of the Company at the relevant time.
Movements in the number of share options outstanding that were issued post 7 November 2002 and their related weighted average exercise prices (WAEP) are as follows:
31 March 2025
|
|
ESOT |
2019 LTIP |
2020 EMI Option Plan |
2022 EMI Option Plan |
Salary Sacrifice Plan |
||||||||
|
|
Options |
WAEP |
Options |
WAEP |
Options |
WAEP |
Options |
WAEP |
Options |
WAEP |
|
||
|
Outstanding at beginning of year |
50,000 |
92.50p |
1,500,000 |
45.00p |
2,728,028 |
46.20p |
1,249,998 |
48.00p |
13,066,665 |
– |
|
||
|
Granted |
– |
– |
– |
– |
– |
– |
– |
– |
– |
– |
|
||
|
Expired / forfeited |
– |
– |
– |
– |
(270,833) |
(48.00)p |
(1,041,665) |
(48.00)p |
(3,333,333) |
– |
|
||
|
Exercised |
– |
– |
– |
– |
– |
– |
– |
– |
– |
– |
|
||
|
Outstanding at end of year |
50,000 |
92.50p |
1,500,000 |
45.00p |
2,457,195 |
46.00p |
208,333 |
48.00p |
9,733,332 |
– |
|
||
|
Exercisable at end of year |
50,000 |
92.50p |
1,500,000 |
45.00p |
2,457,195 |
46.00p |
208,333 |
48.00p |
9,733,332 |
– |
|
||
|
WA Life* |
1.01yrs |
5.10 yrs |
8.68 yrs |
7.32 yrs |
9.27 yrs |
||||||||
* WA Life represents the weighted average contractual life in years to the expiry date for options outstanding at the end of the year.
|
|
31 March 2024 |
||||||||||||
|
|
ESOT |
ESOT |
2019 LTIP |
2020 EMI Option Plan |
2022 EMI Option Plan |
Salary Sacrifice Plan |
|||||||
|
|
Options |
WAEP |
Options |
WAEP |
Options |
WAEP |
Options |
WAEP |
Options |
WAEP |
Options |
WAEP |
|
|
Outstanding at beginning of year |
250,000 |
74.50p |
50,000 |
92.5p |
1,650,000 |
45.00p |
2,936,361 |
44.45p |
2,678,568 |
46.00p |
– |
– |
|
|
Granted |
– |
– |
– |
– |
– |
– |
– |
– |
– |
– |
13,066,665 |
– |
|
|
Expired / forfeited |
(250,000) |
(74.50)p |
– |
– |
(150,000) |
(45.00)p |
(208,333) |
(48.00)p |
(1,428,570) |
(46.00)p |
– |
– |
|
|
Exercised |
– |
– |
– |
– |
– |
– |
– |
– |
– |
– |
– |
– |
|
|
Outstanding at end of year |
– |
– |
50,000 |
92.50p |
1,500,000 |
45.00p |
2,728,028 |
46.20p |
1,249,998 |
48.00p |
13,066,665 |
– |
|
|
Exercisable at end of year |
– |
– |
50,000 |
92.50p |
1,500,000 |
45.00p |
2,728,028 |
46.20p |
1,249,998 |
48.00p |
3,266,666 |
– |
|
|
WA Life* |
– |
2.01 yrs |
6.10 yrs |
9.68 yrs |
8.32 yrs |
10.27 yrs |
|||||||
* WA Life represents the weighted average contractual life in years to the expiry date for options outstanding at the end of the year.
The pricing models used to value these options and their inputs are as follows:
|
|
|
Pricing Models |
||||
|
|
ESOT |
ESOT |
2019 LTIP |
2020 EMI Option Plan |
2022 EMI Option Plan |
Salary Sacrifice Plan |
|
Pricing model |
Monte Carlo |
N/A |
Black Scholes |
Black Scholes |
Black Scholes |
N/A |
|
Date of grant |
28/10/13-13/4/16 |
30/05/17 |
28/06/19 & 28/12/19 |
01/11/20 – 01/09/21 |
01/04/22 – 01/11/22 |
28/09/23 |
|
Share price at grant (p) |
74.5-114.5 |
125 |
45.0 & 49.0 |
42.0-56.5 |
30.0-45.00 |
5.5 |
|
Exercise price (p) |
0.0-114.5 |
– |
45.0 & 49.0 |
0.0-58.0 |
42.0-48.0 |
– |
|
Expected volatility (%) |
43.0000-37.0000 |
N/A |
50 |
50 |
21-22 |
N/A |
|
Expected life (years) |
5 |
3 |
3 |
1-3 |
3 |
2 |
|
Risk-free rate (%) |
0.8000-1.9300 |
N/A |
2 |
5 |
1.38-3.22 |
N/A |
|
Expected dividend yield (%) |
0.67-2.19 |
N/A |
N/A |
N/A |
N/A |
N/A |
30. Capital commitments
There were no capital commitments for the Group or the Company as at 31 March 2025 (FY24: £nil).
31. Related party transactions
Group
Services rendered to related parties were on the Group’s normal trading terms in an arms’ length transaction. Amounts outstanding are unsecured and will be settled in accordance with normal credit terms. No guarantees have been given or received. No provision (FY24: £nil) has been made for impaired receivables in respect of the amounts owed by related parties.
Key management personnel include Executive and Non-Executive Directors of WH Ireland Group plc and all its subsidiaries. They can undertake transactions in stocks and shares in the ordinary course of the Group’s business, for their own account and are charged for this service, as with any other client. The transactions are not material to the Group in the context of its operations, but may result in cash balances on the Directors’ client accounts owing to or from the Group at any one point in time. The charges made to these individuals and the cash balances owing from/due to them are disclosed in the table below. There are no other material contracts between the Group and the Directors.
No transactions occurred with key management personnel and other relates parties during the year ended 31 March 2025 or 31 March 2024.
The total compensation of key management personnel is shown below:
|
|
Year ended 31 March 2025 |
Year ended 31 March 2024 |
|
|
£’000 |
£’000 |
|
Short-term employee benefits |
2,671 |
2,565 |
|
|
2,671 |
2,565 |
The highest paid Director for 2025 was P Wale receiving emoluments of £521,845 (FY24: £374,216).
Company
The Parent Company received a management charge of £1,017k (FY24: £999k) from its subsidiary WH Ireland Limited.
Transactions between the Company and its subsidiaries, which are related parties, have been eliminated on consolidation. The captions in the primary statements of the Parent Company include amounts attributable to subsidiaries. These amounts have been disclosed in aggregate in the notes 15, 19 and 22 and in detail in the following table:
|
|
Amounts owed by related parties |
Amounts owed to related parties |
||
|
|
2025 |
2024 |
2025 |
2024 |
|
|
£’000 |
£’000 |
£’000 |
£’000 |
|
Readycount Limited |
– |
– |
– |
– |
|
Stockholm Investments Limited |
– |
– |
– |
– |
|
WH Ireland Limited |
4,050 |
4,676 |
– |
– |
|
Harpsden WM Limited |
– |
– |
295 |
295 |
|
WH Ireland Trustee Limited |
– |
– |
17 |
17 |
|
|
4,050 |
4,676 |
312 |
312 |
The net amount owed to related parties is £3,738 (FY24: £4,364k owed by related parties) (see note 19 and 22).
The placing that took place during the prior year resulted in an amount owed by WH Ireland Limited to the Parent Company of £4.7m. This is due to the shares included in the placing were in the Parent Company, and the cash received by WH Ireland Limited to be used in the operation of the business.
32. Events after the reporting date
Advancement in discussion for the sale of the WM business
After the year end the Group announced the conditional disposal of the WM business. Consequently, the sale of this division is deemed highly probable and reaffirms the presentation as held for sale and a discontinued operation in the 2025 financial year. Following Completion, the Board intends to implement a wind-down of the Group by way of a liquidation and to return any remaining distributable reserves to shareholders once all liabilities, transaction costs and wind-down expenses have been settled. In that context, the Directors have conducted a review of the advantages and disadvantages of having the Company’s ordinary shares trading on AIM, a market of the London Stock Exchange and have unanimously concluded that as a result of the sale and, in any event, given the significant costs involved, there is insufficient benefit in maintaining the Admission.
RNS may use your IP address to confirm compliance with the terms and conditions, to analyse how you engage with the information contained in this communication, and to share such analysis on an anonymised basis with others as part of our commercial services. For further information about how RNS and the London Stock Exchange use the personal data you provide us, please see our Privacy Policy.
END
FR SELFLMEISELU